Quality Measures
Streamlining Quality of Care Tracking

The healthcare industry relies heavily on quality measures to evaluate patient care, ensure compliance, and maximize financial incentives. However, despite access to vast amounts of data, primary care providers (PCPs) faced significant challenges in managing and leveraging this information effectively. Fragmented workflows meant that quality care metrics were scattered across multiple, disconnected systems, forcing providers to navigate complex interfaces just to access critical data.
In addition to disjointed systems, PCPs also struggled with manual data processing, spending excessive time consolidating information instead of focusing on patient care. Even when data was available, tools often lacked actionable insights, making it difficult to filter, prioritize, and act on patients efficiently. Without a centralized solution, PCPs could not effectively track metrics, manage patient care, or optimize their performance against quality standards.
Goal: Develop an intuitive platform to access, monitor, and act on quality care data.
Goal: Conduct extensive external and internal research to uncover PCP pain points.
Our UX research engaged PCPs and internal subject matter experts (SMEs) to uncover challenges in accessing and utilizing quality care metrics. Through interviews, workflow analysis, and participatory design, we identified fragmented workflows, manual data processing, and limited actionable insights as major pain points. Providers struggled to consolidate clinical, financial, and patient-level data, making it difficult to track quality performance. Internal research with stakeholders and SMEs ensured the solution was technically feasible and scalable.
This research highlighted inefficiencies while revealing key opportunities for improvement. Users needed real-time filtering to prioritize patients, better visibility into patient details for timely interventions, and a simplified way to manage financial and clinical metrics. These insights guided our approach, shaping a more intuitive, efficient, and scalable experience that aligned with both user needs and business goals.
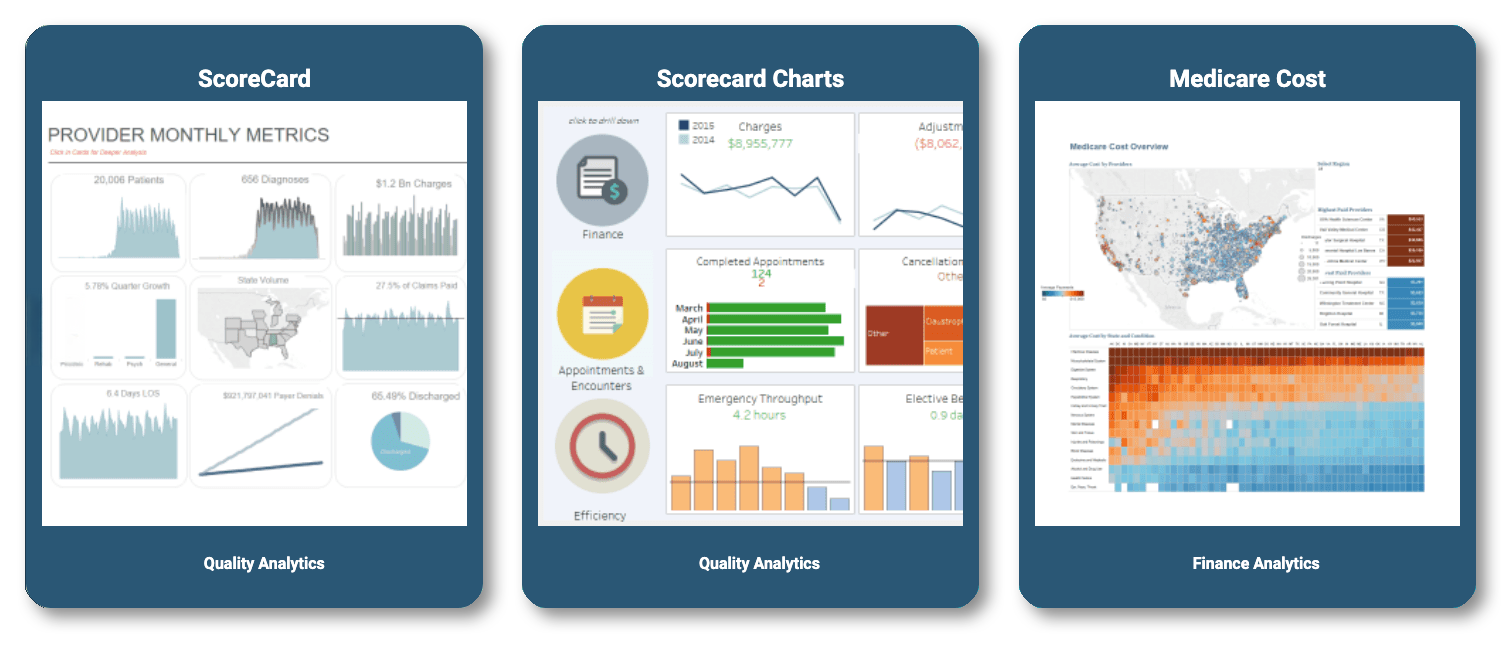
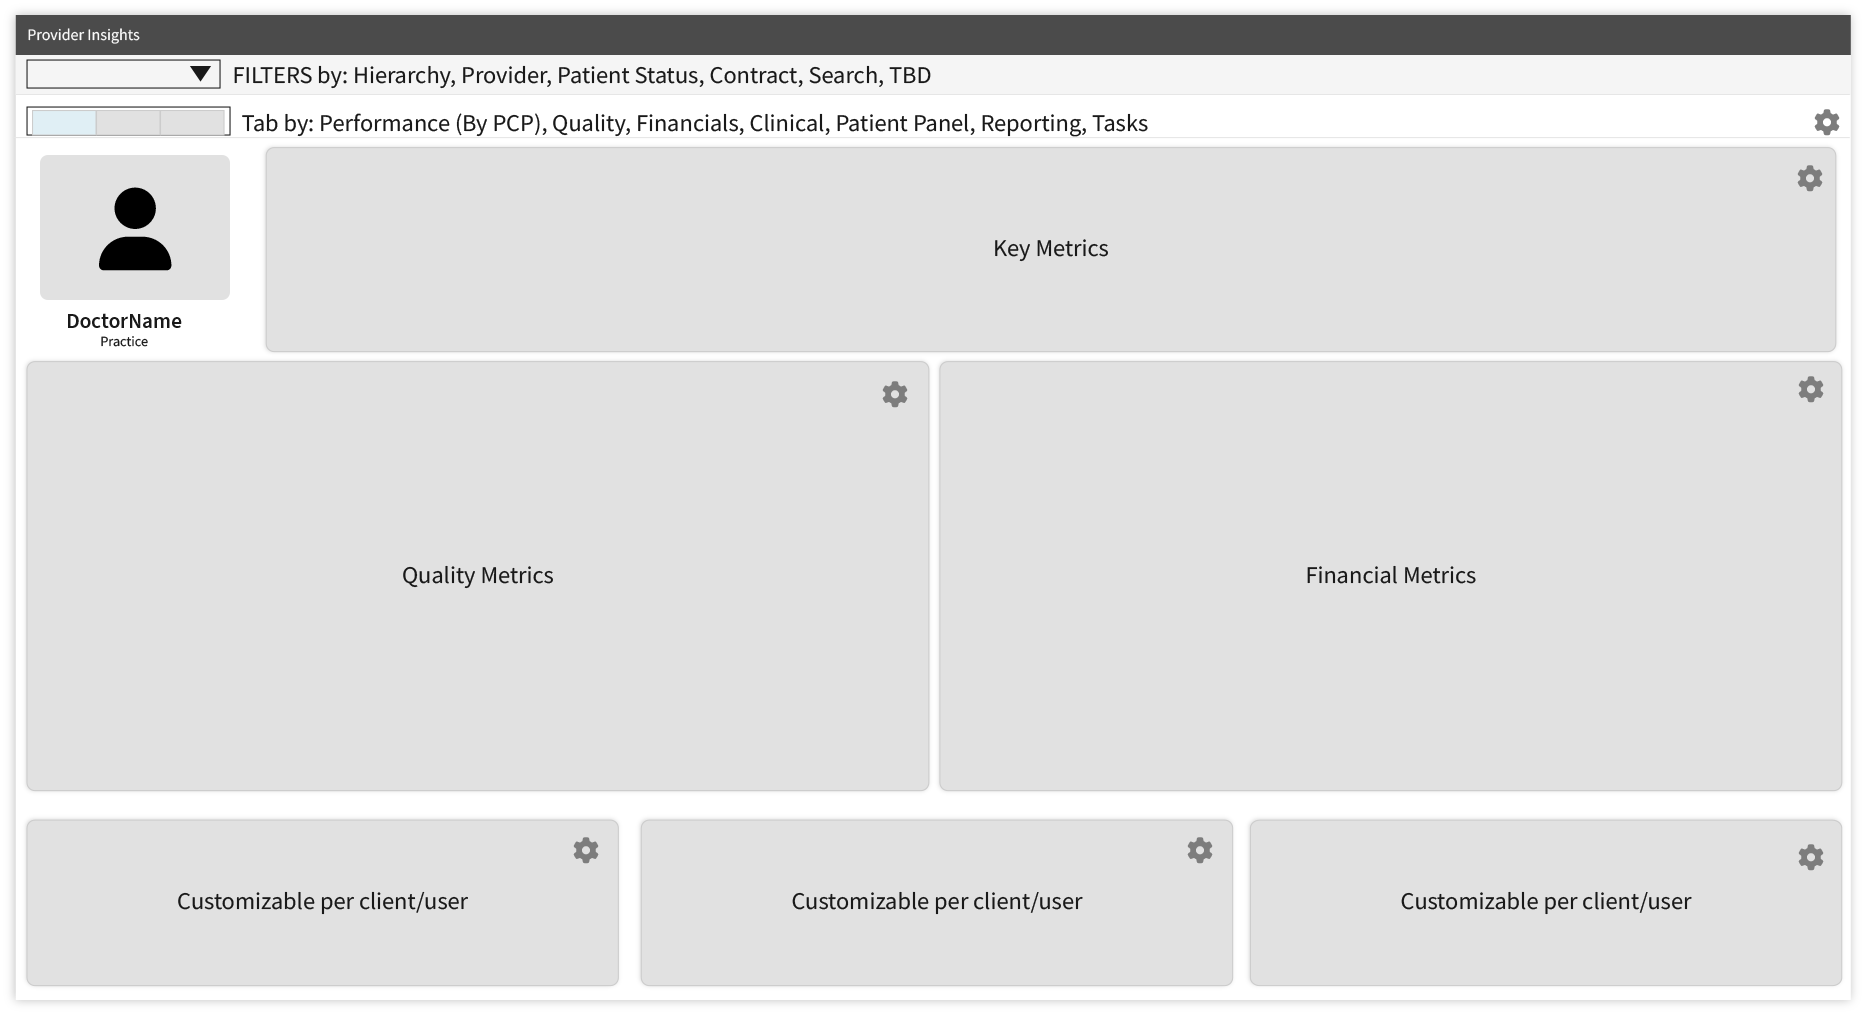
Our findings revealed the need for a multi-faceted dashboard capable of switching between high-level summaries and detailed patient views. To address these needs, we envisioned a scalable solution that would help PCPs manage metrics, optimize performance, and enhance patient care.
The success of Quality Measures came from a design process that put user feedback, collaboration, and continuous refinement at the forefront. Every decision was shaped by real PCP needs, business goals, and technical feasibility, ensuring the platform was both practical and scalable.
By focusing on continuous improvements, reduce risk, streamline workflows, we created a flexible, user-friendly solution that helps PCPs track, manage, and act on quality care metrics.

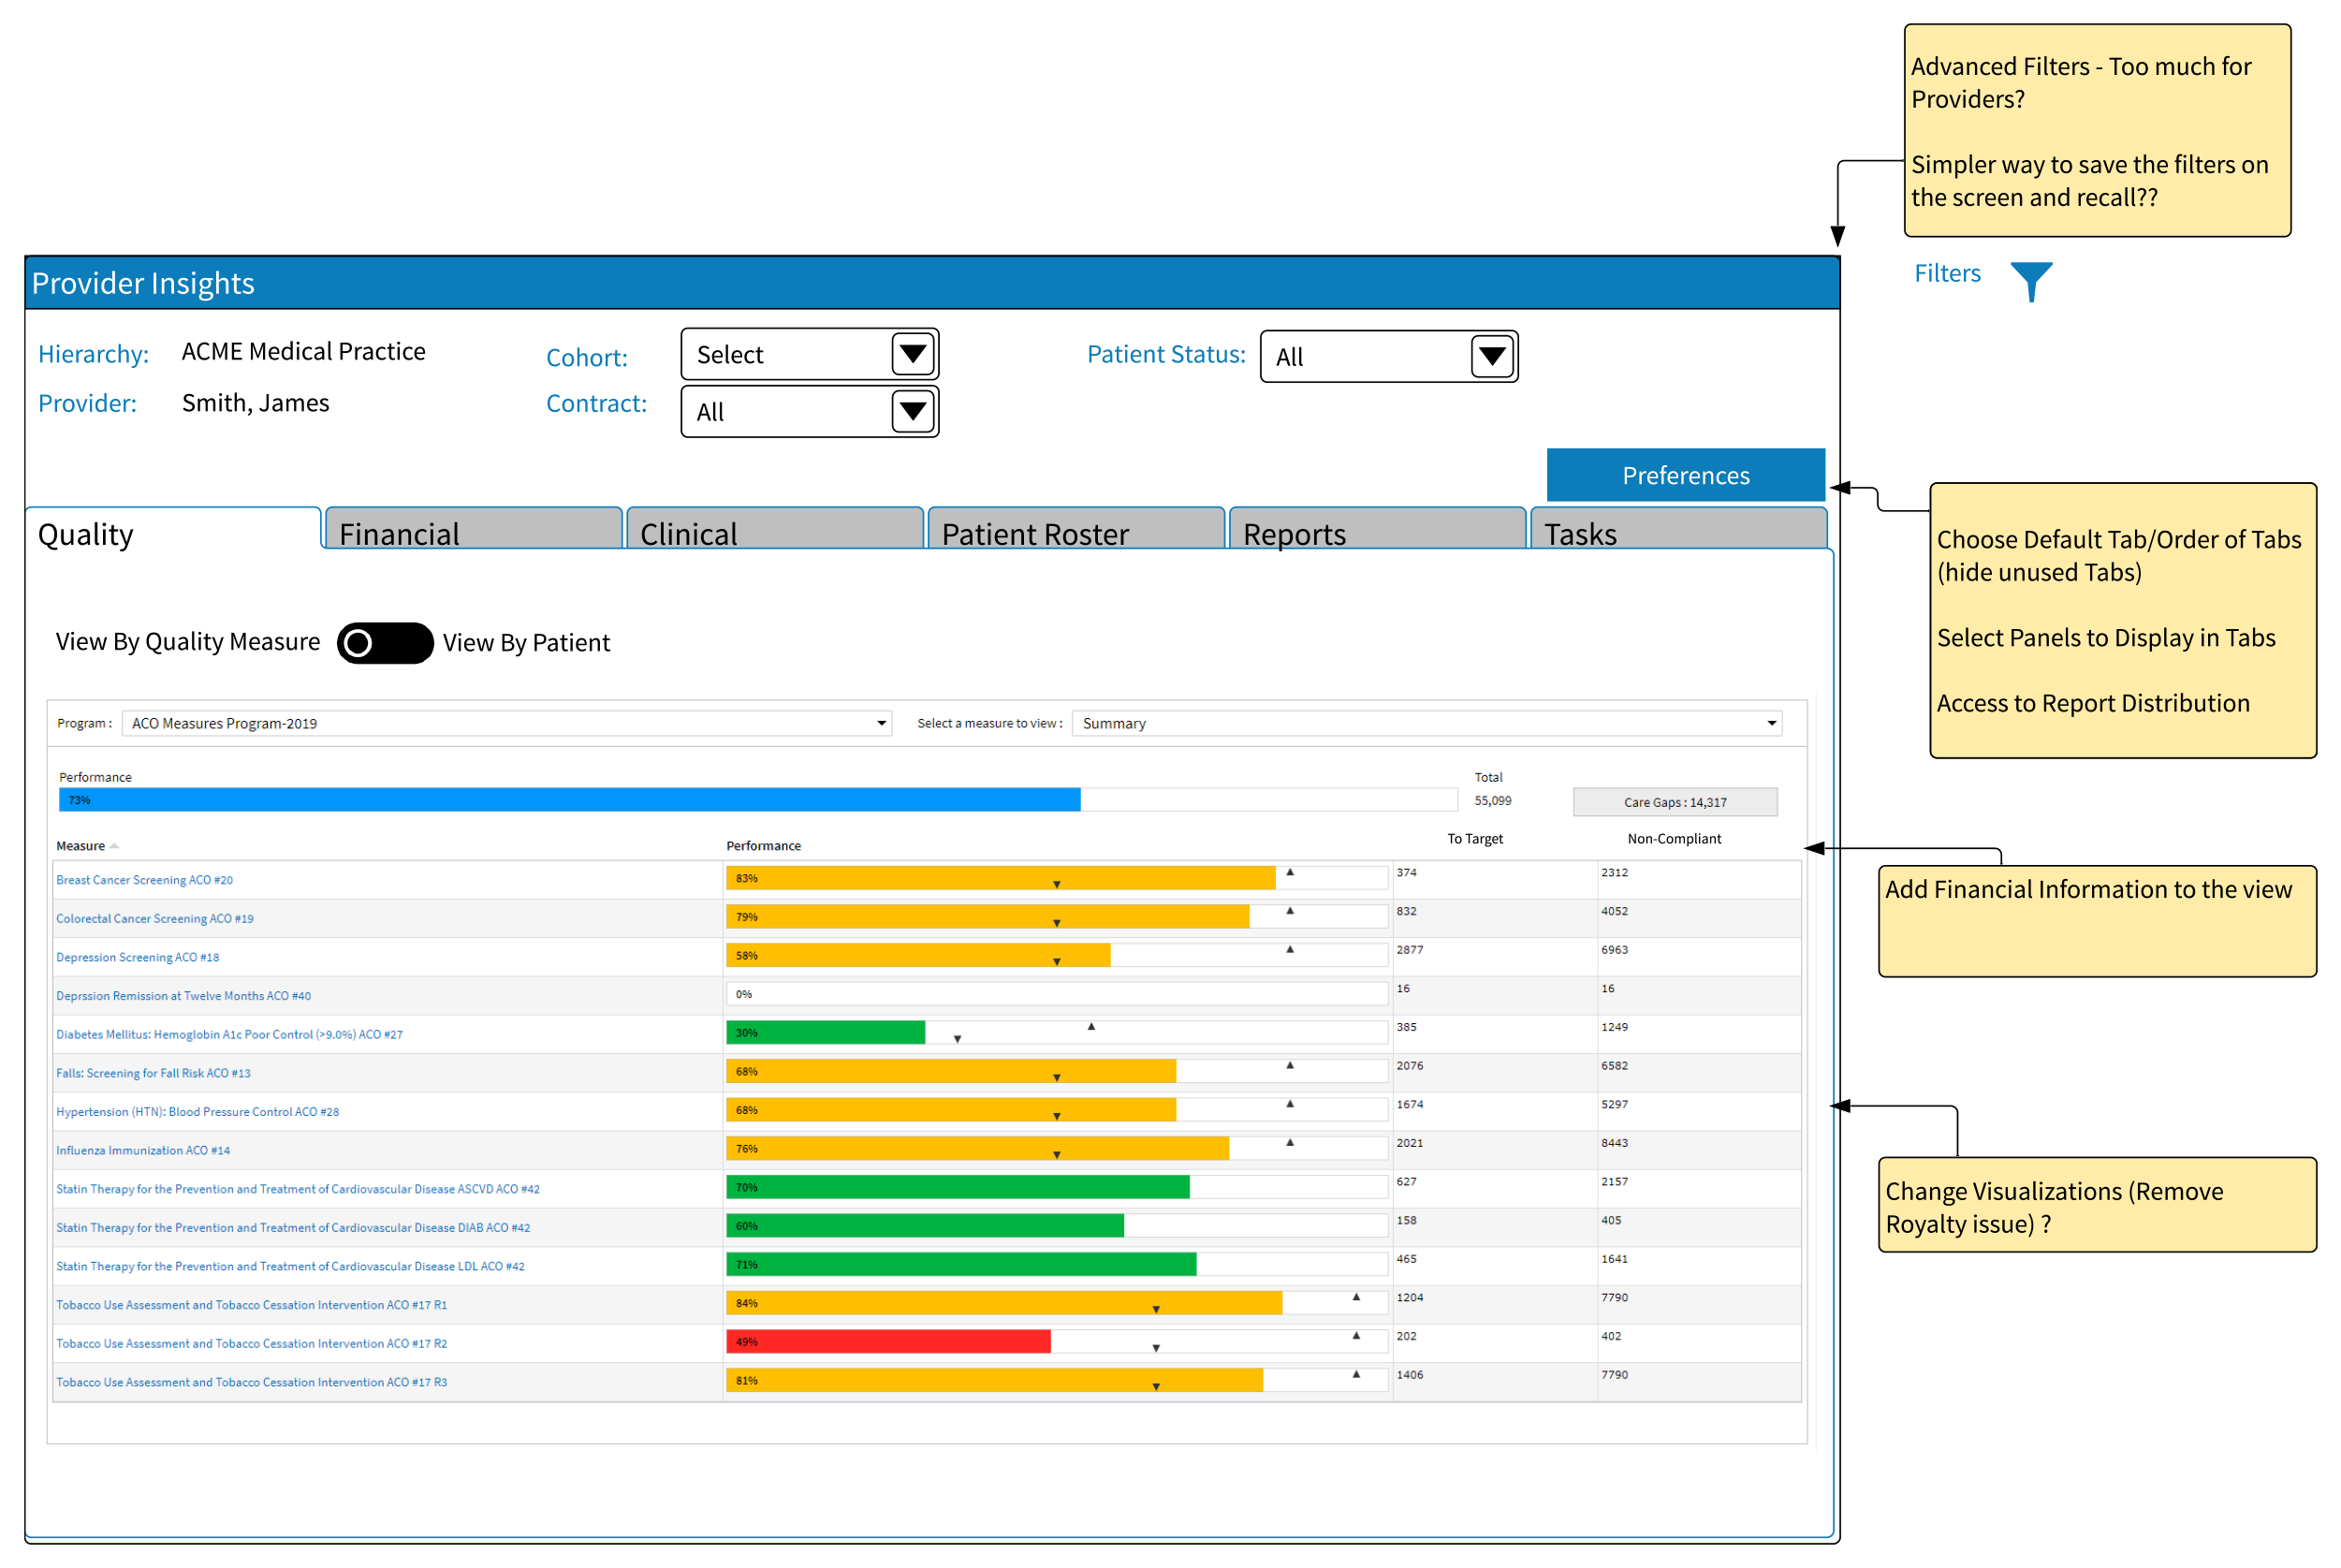
User feedback guided refinements to filtering options, navigation clarity, and report layouts.

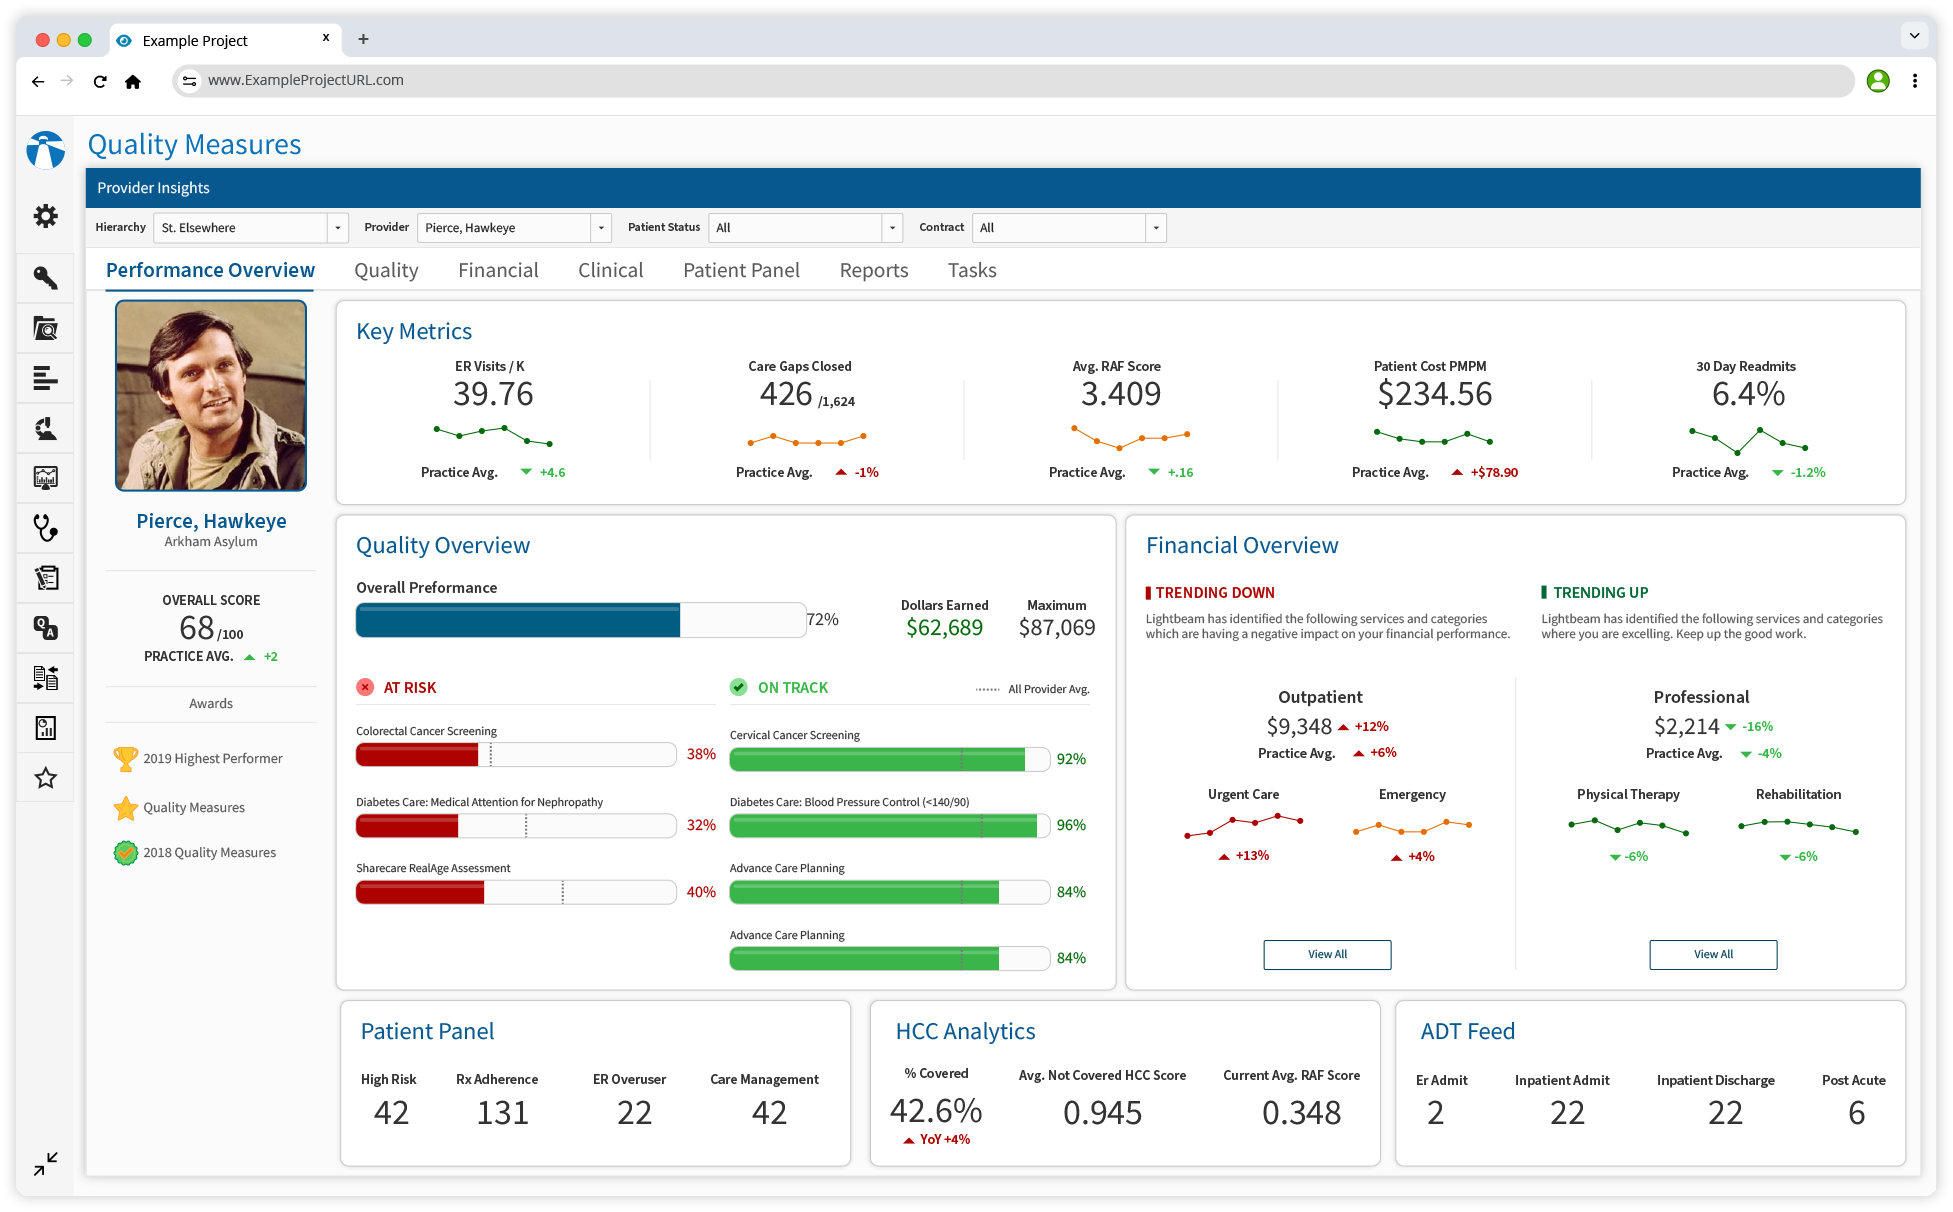
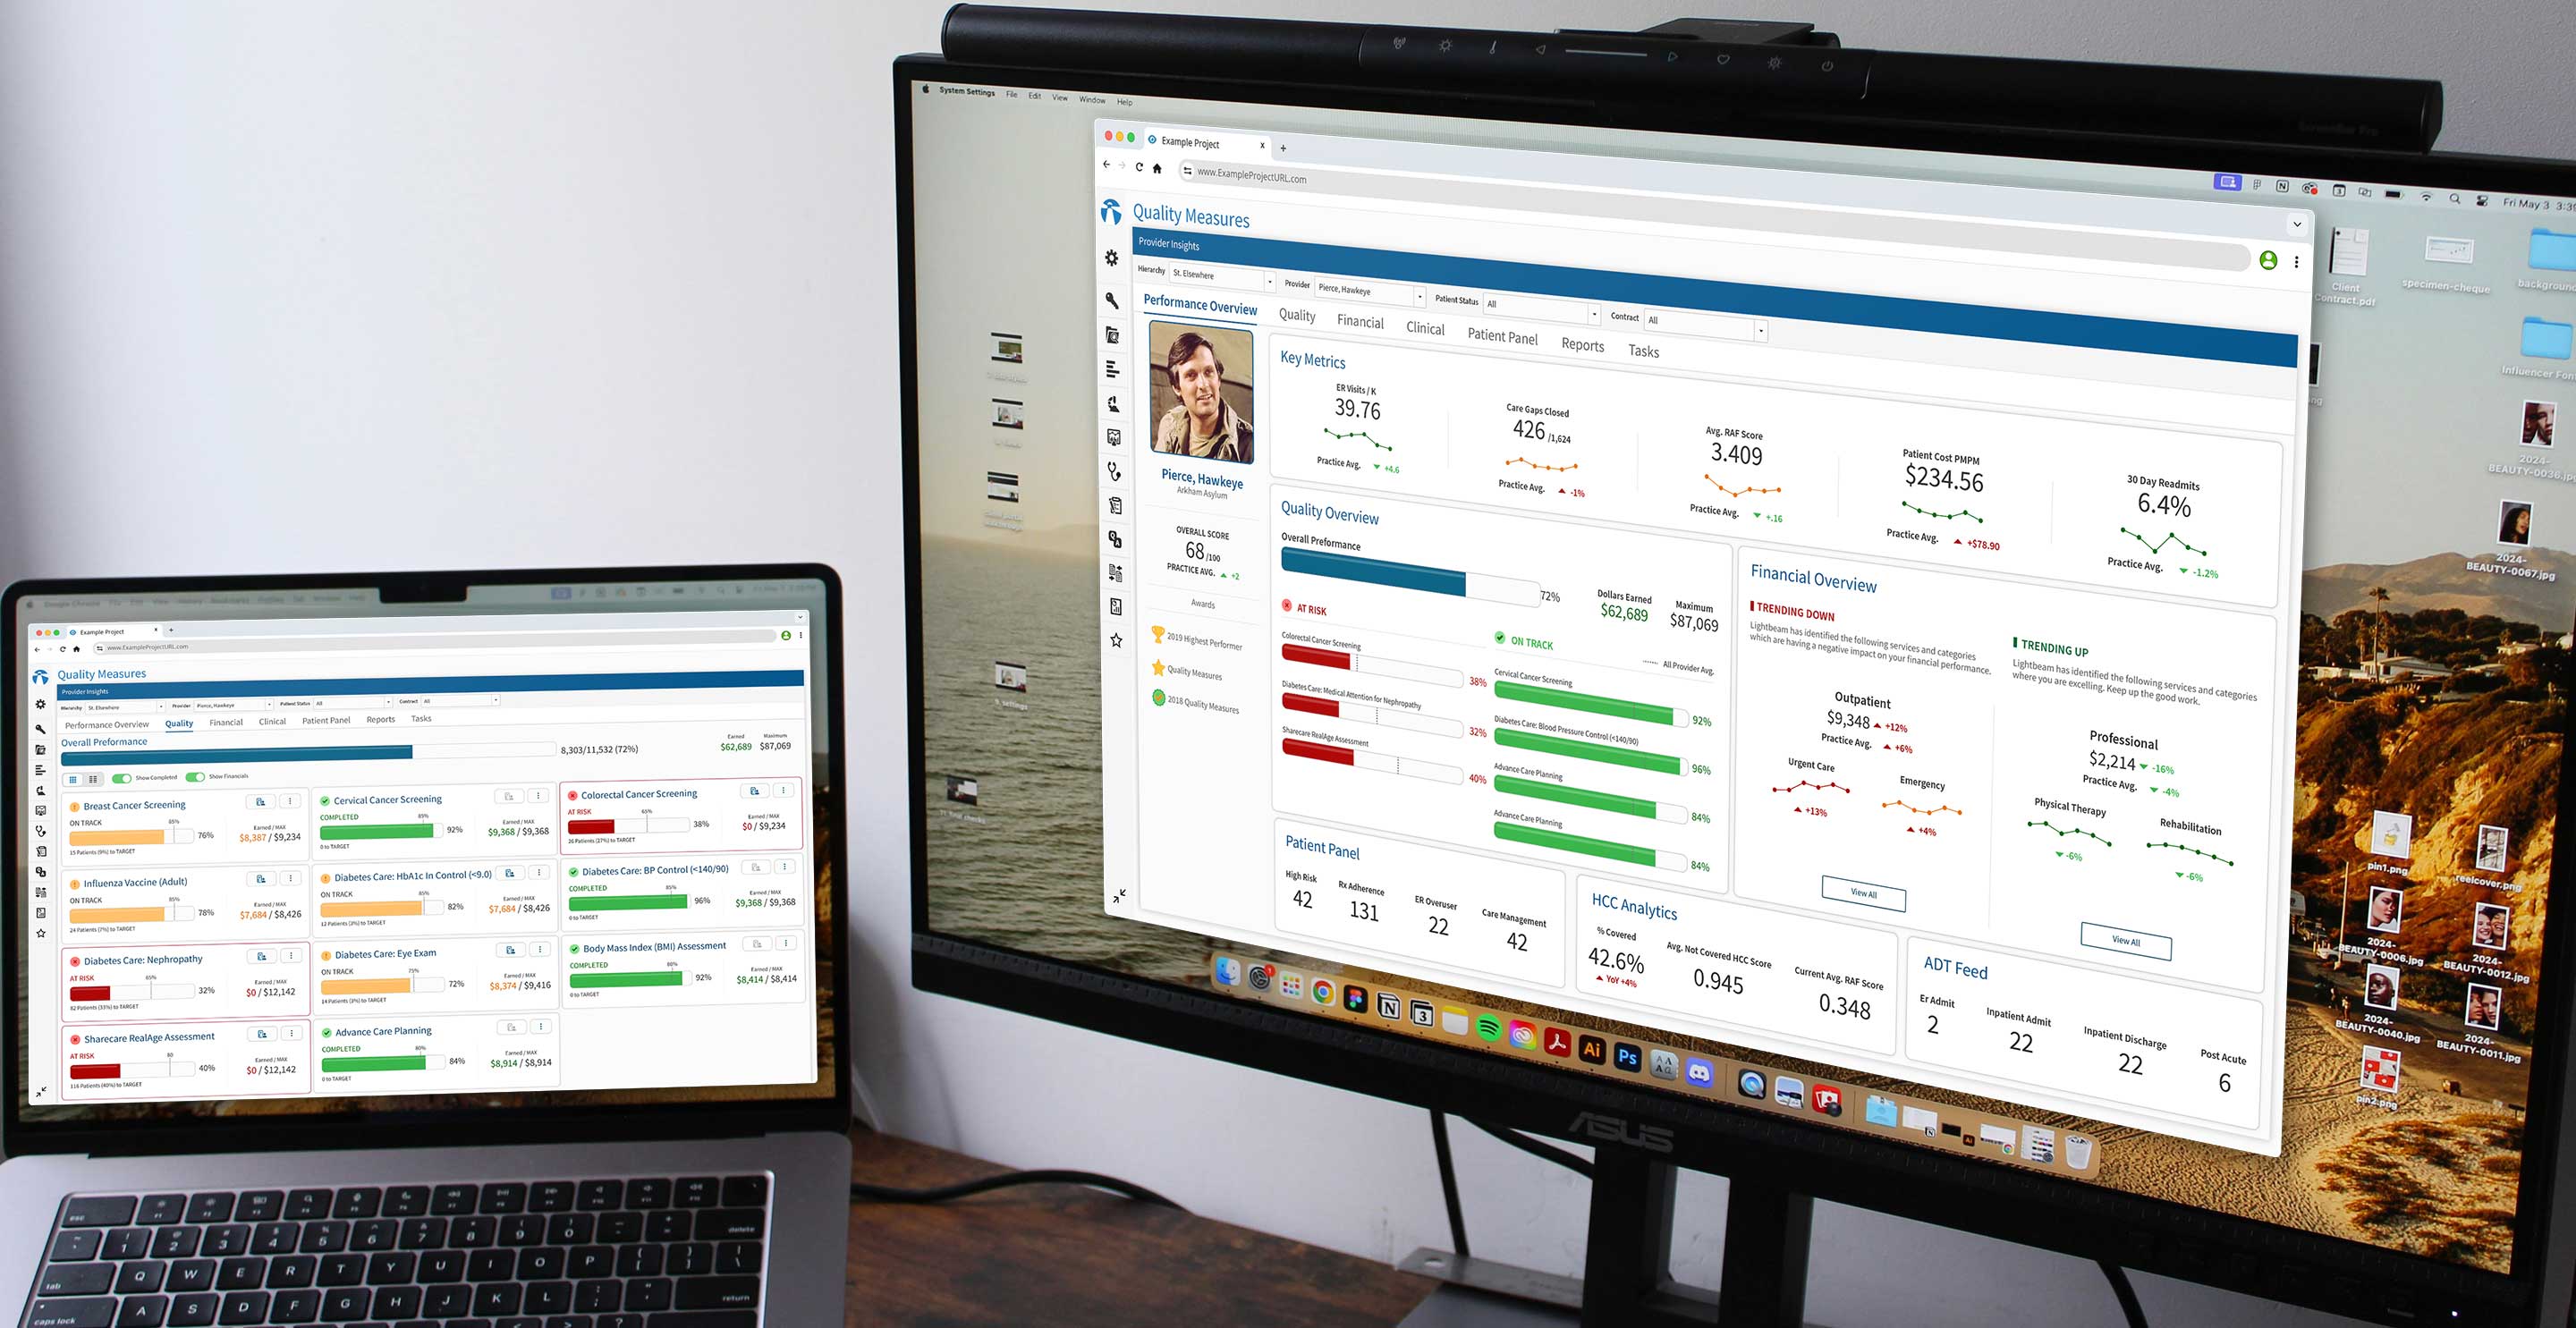
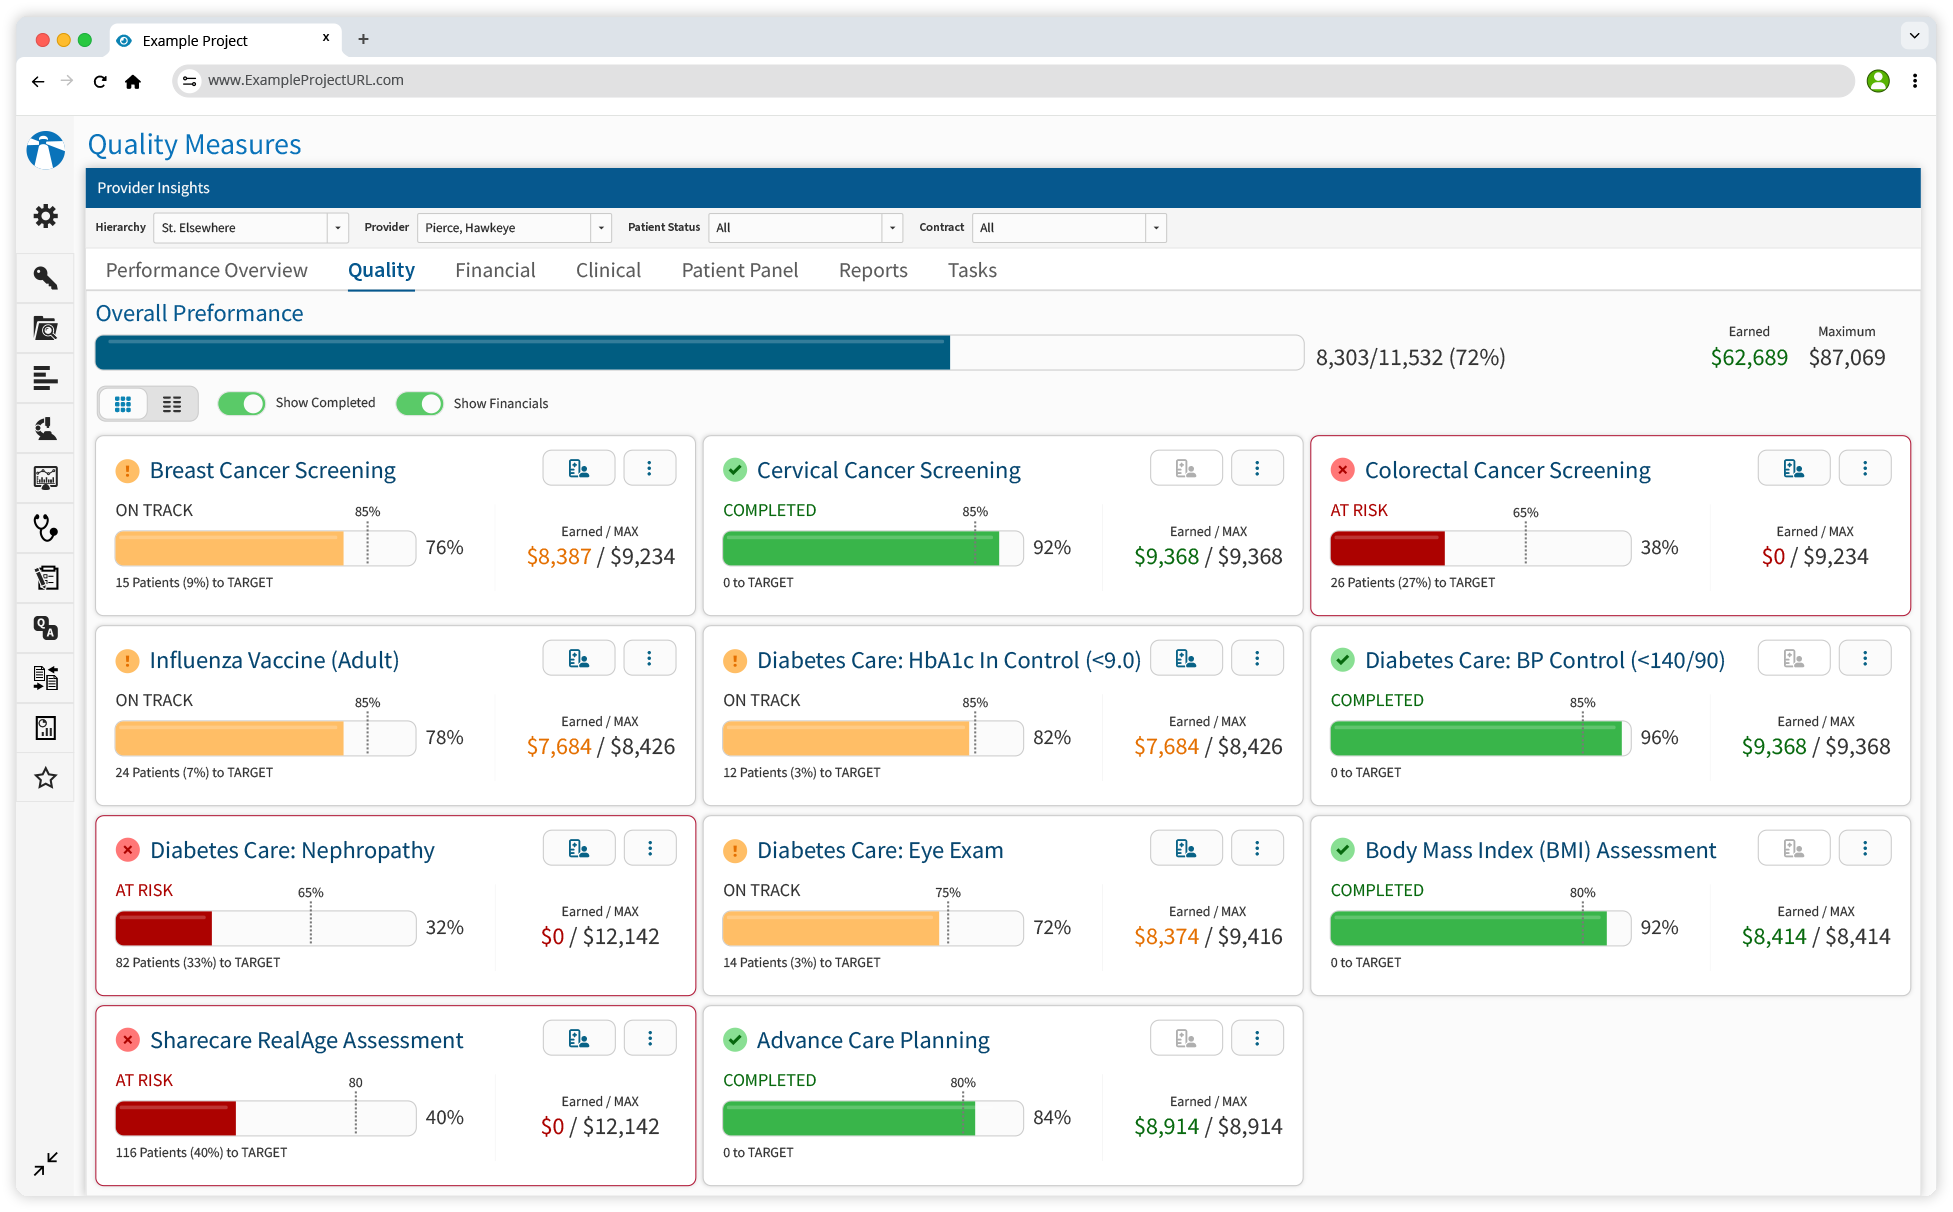
The Quality Measures Dashboard streamlines how PCPs track, manage, and act on care metrics by consolidating essential tools into a single, intuitive platform. Designed to fit seamlessly into existing workflows, it ensures that providers can quickly access patient data, track compliance, and make informed decisions without unnecessary complexity.
By integrating these capabilities, the dashboard not only improves day-to-day efficiency but also empowers providers to deliver high-quality care while meeting organizational objectives — all within a system built for speed, accuracy, and ease of use.
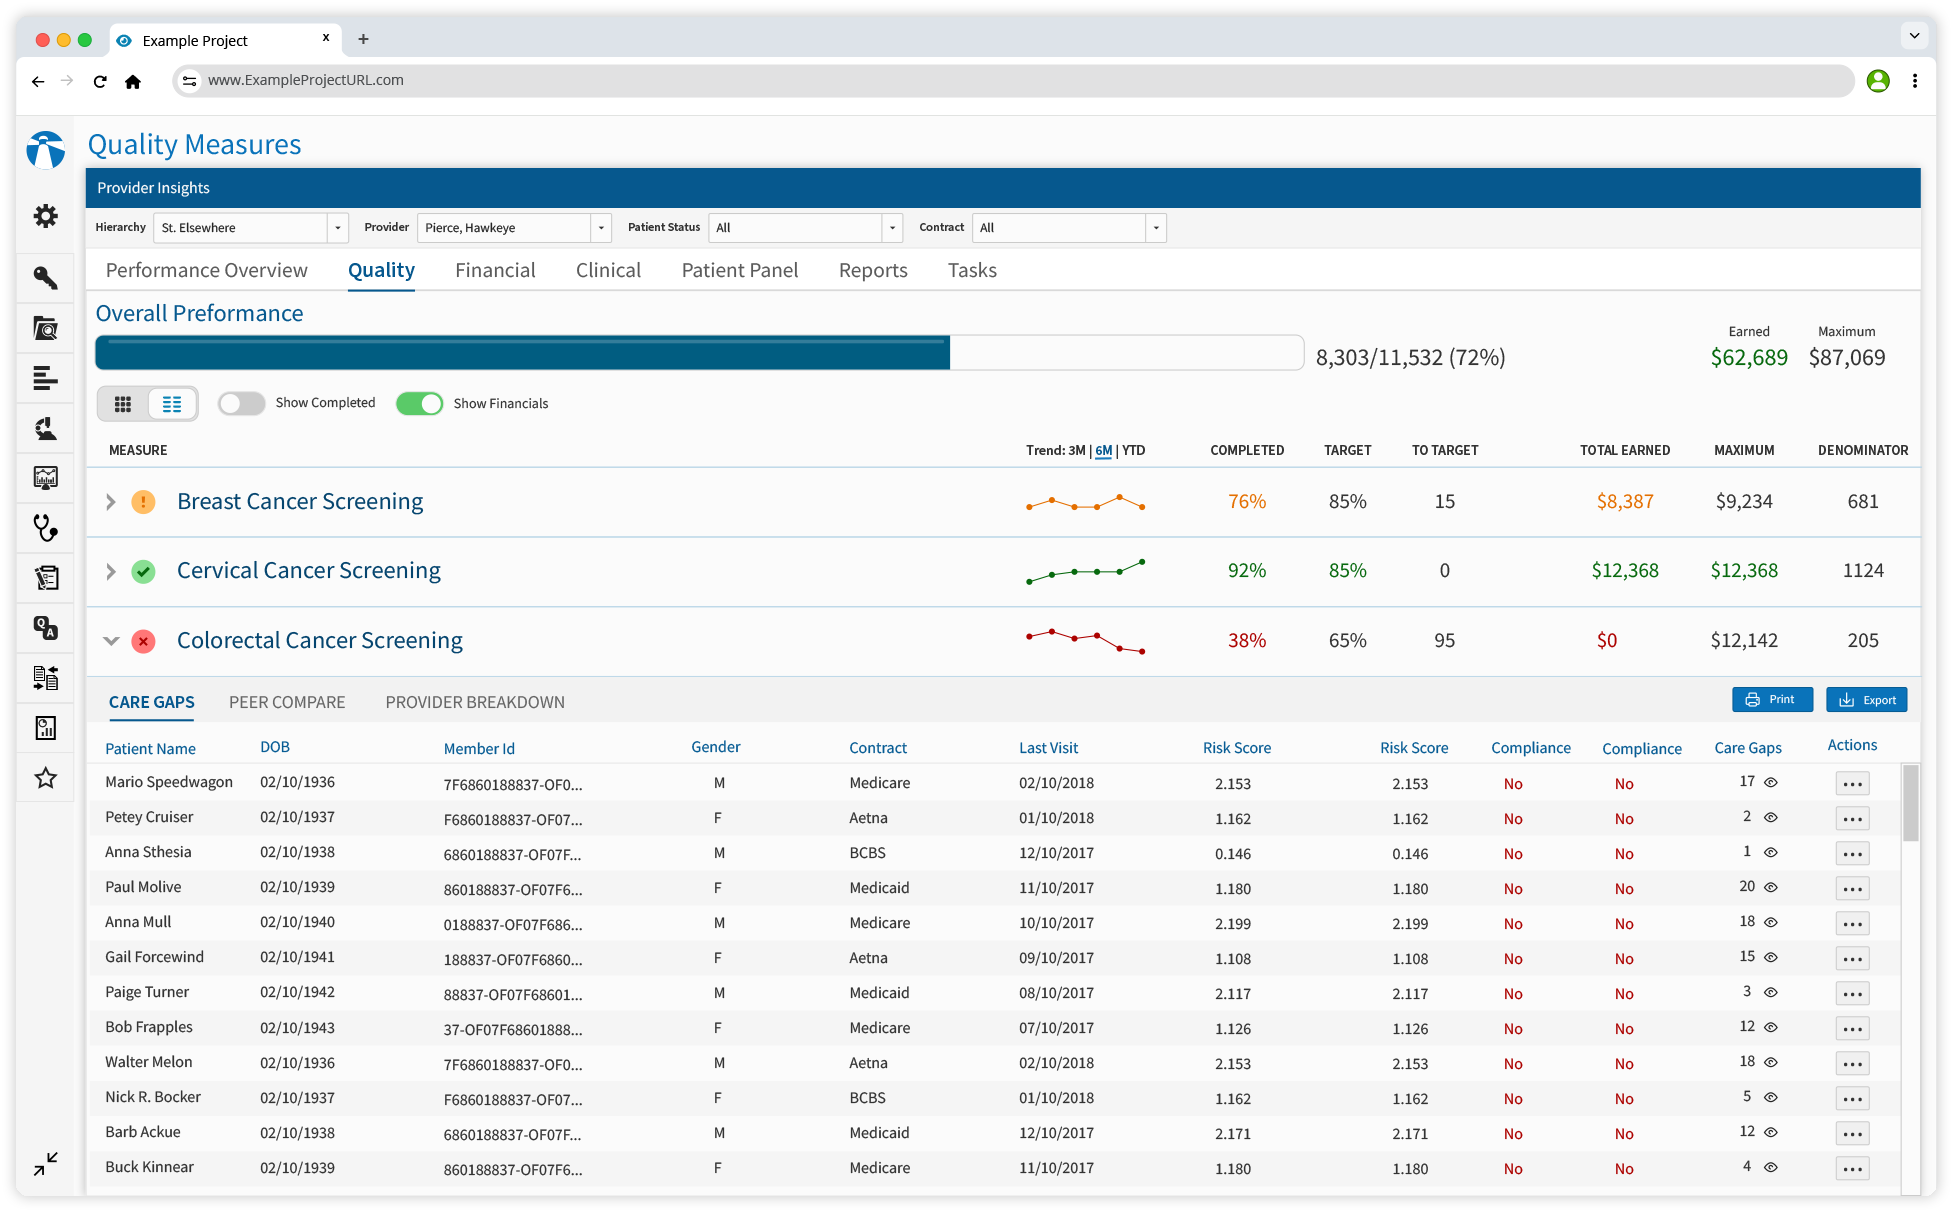
Quickly open patient charts directly from the dashboard for immediate review of medical histories, recent visits, and ongoing treatments—enabling faster decision-making and personalized care.
Effortlessly arrange appointments, follow-ups, and rescheduling, ensuring organized patient management while reducing wait times and enhancing satisfaction.
Highlights quality measures relevant to each patient, guiding providers on necessary actions to meet compliance standards and improve care quality.
Document patient information during consultations, ensuring accuracy and up-to-date records while meeting quality measure requirements.
Prioritize patients based on urgency, screening schedules, or specific criteria, allowing providers to focus on critical cases efficiently.
Identify intervention opportunities that enhance patient outcomes and financial performance, empowering providers with data-driven decisions.
Reduction in time spent accessing and consolidating patient data.
Faster Task Completion Time
Quality Measures
Increase in user satisfaction ratings over 3 months.
This project reinforced the importance of user-centered design and modular components for scalable solutions. By deeply understanding PCP workflows, we delivered a tool that improved efficiency, empowered users, and supported better patient care.

“The Quality Measures Dashboard has transformed how we manage care metrics—it’s easy, intuitive, and saves us hours each week.”
