Password Protected
Detailed UX Research

Insights: Reporting & Dashboard Creator Product

Energy Industry

Iterative Process

User-Centered Design

Reporting Tools

UX Research

Workflow Analysis

Dashboard Design

Data Visualization

Usability Testing

ADA Accessibility

UX Diagram Details

This project focused on creating a highly intuitive reporting and dashboard tool that directly addressed user needs. Through a structured, six-phase UX research process, we identified key pain points and opportunities for improvement. Each iteration brought us closer to a product that streamlined workflows, improved usability, and delivered a seamless, effective experience for energy professionals.

Role

  • UX Team Manager
  • Lead Researcher

Team

  • 2 UX Designers
  • 1 Director of Analytics
  • 1 Product Manager

Tools

  • Zoom
  • FigJam
  • Miro

Timeline

  • 90 Days
  • Nov. 2023
Phase 1

Kickoff User Interviews

Business Discovery Phase Graphic

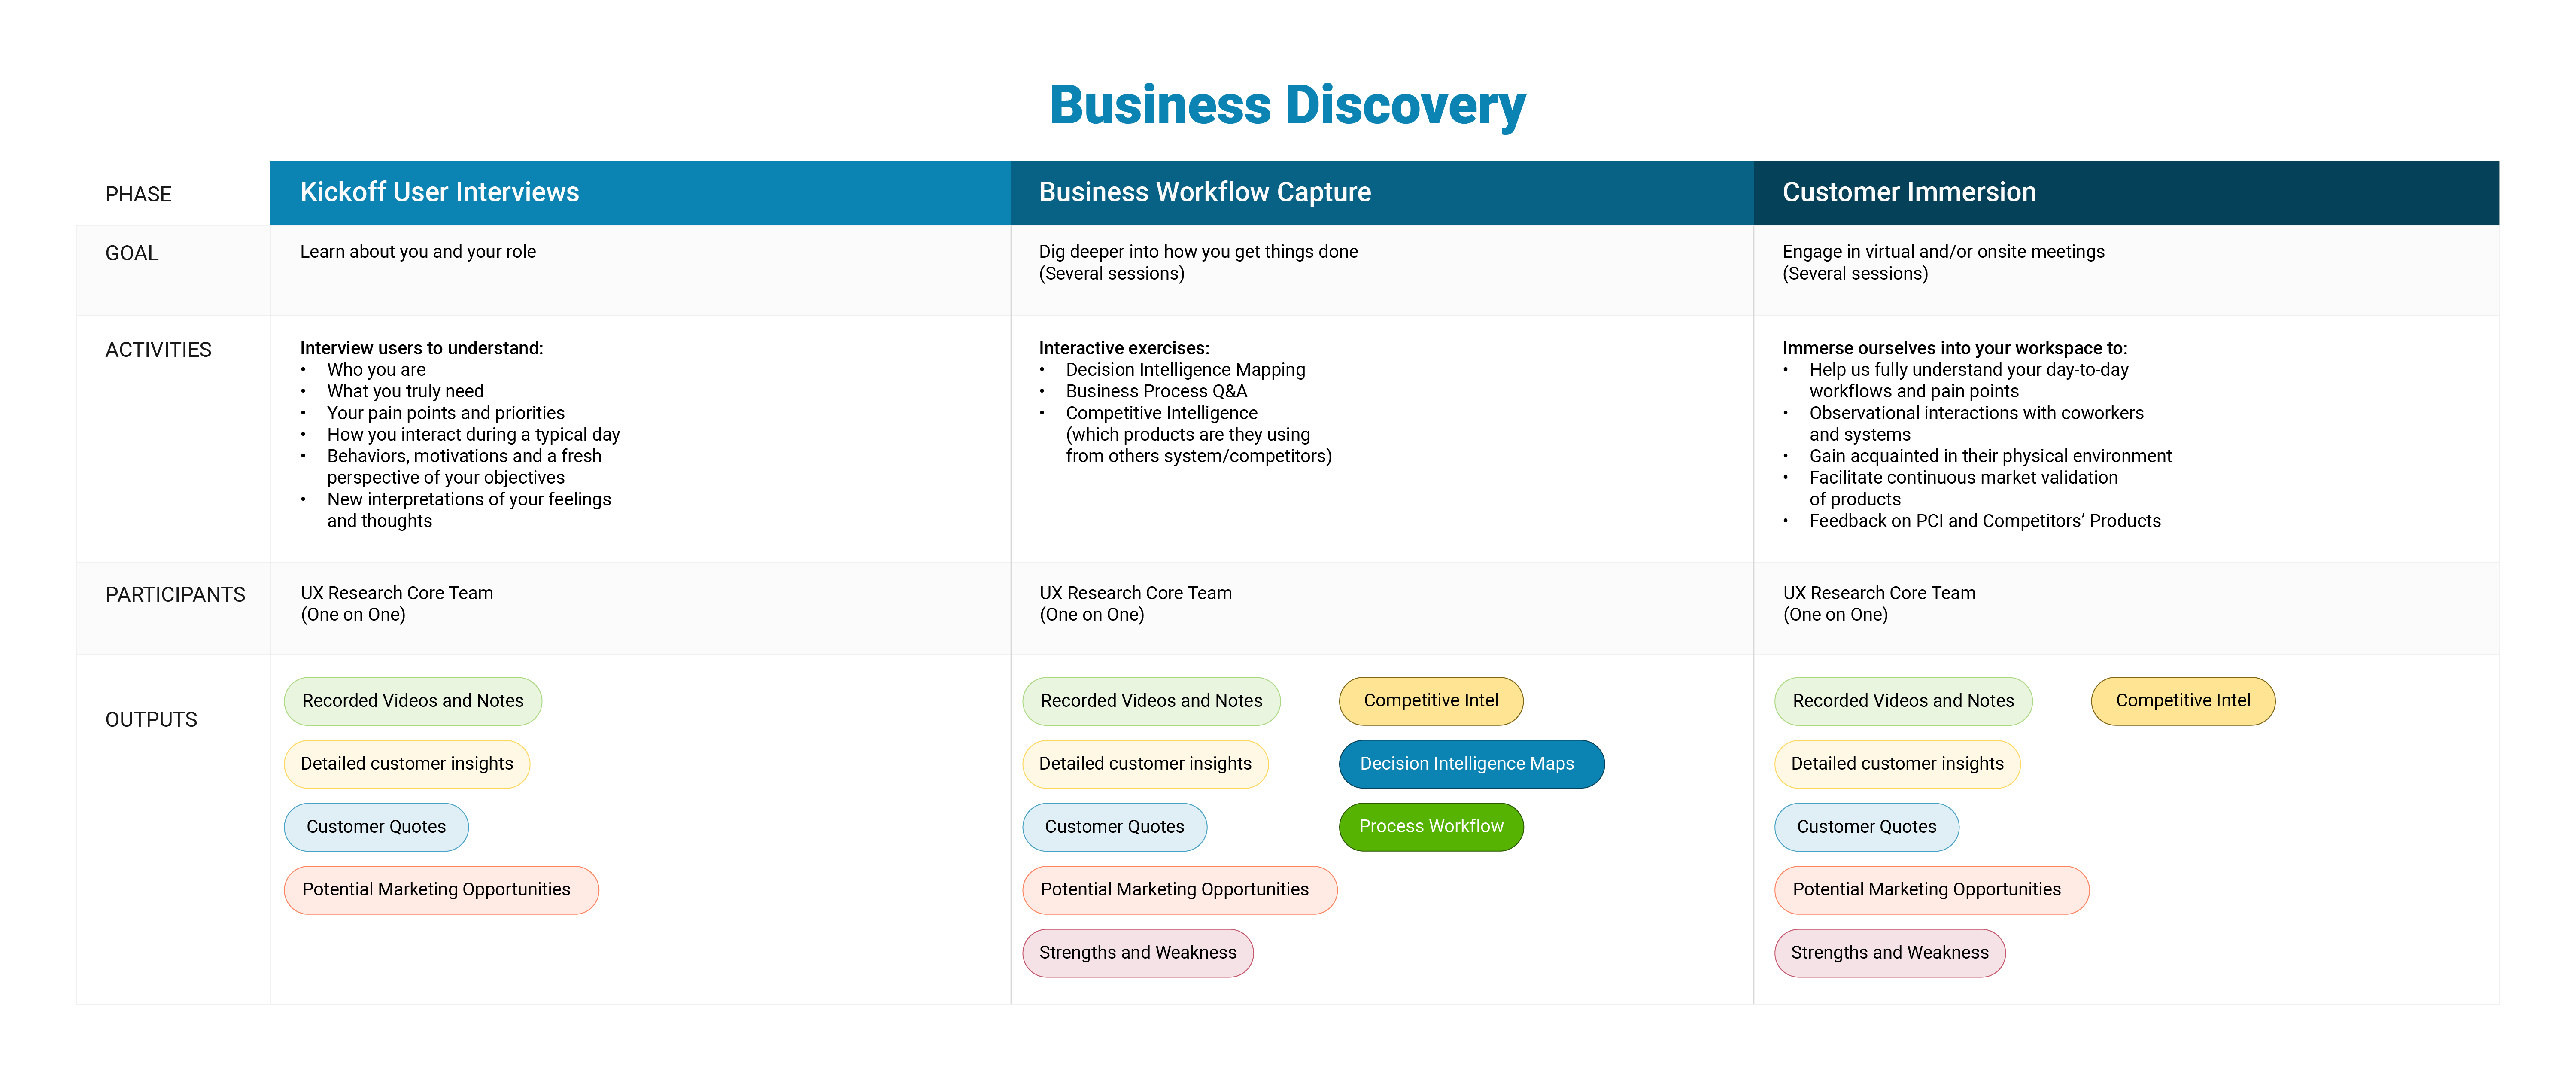
Goal: Understand user roles, needs, pain points, and daily workflows.

Our research began with in-depth user interviews, where the UX research core team conducted one-on-one sessions to understand how users interact with reporting tools within their organizations. These 30-minute sessions focused on uncovering pain points, priorities, and motivations, giving us a fresh perspective on their needs. By capturing emotional insights and new interpretations of their experiences, we moved beyond assumptions and into actionable knowledge.

Key Activities

  • User Role & Needs Assessment: Conducted interviews to uncover users' roles, workflows, and challenges, laying the groundwork for design strategies.
  • Behavior & Workflow Analysis: Explored daily tasks to identify inefficiencies and opportunities for process improvements.
  • Perspective Gathering: Captured insights into user objectives, ensuring the solution aligned with their real-world needs.

Outputs

  • Recorded Videos & Notes: Documented user perspectives to inform design decisions.
  • Detailed Customer Insights: Provided a foundational understanding of user expectations.
  • Customer Quotes: Extracted key statements to shape product strategies.
  • Early User Needs Definition: Helped guide initial design directions.
CAISO Market Manager Headshot

“None of my internal customers want to interface with your reports, they want me to do it for them.”

- Market Analytics Manager, CPS
CAISO Market Manager Headshot

“When you use Microsoft you can do things with a click of a button, with you guys, you need IT support and coding”

- Lead Analyst Energy Accounting, Duke Energy
Phase 2

Business Workflow Capture

DIM Diagram

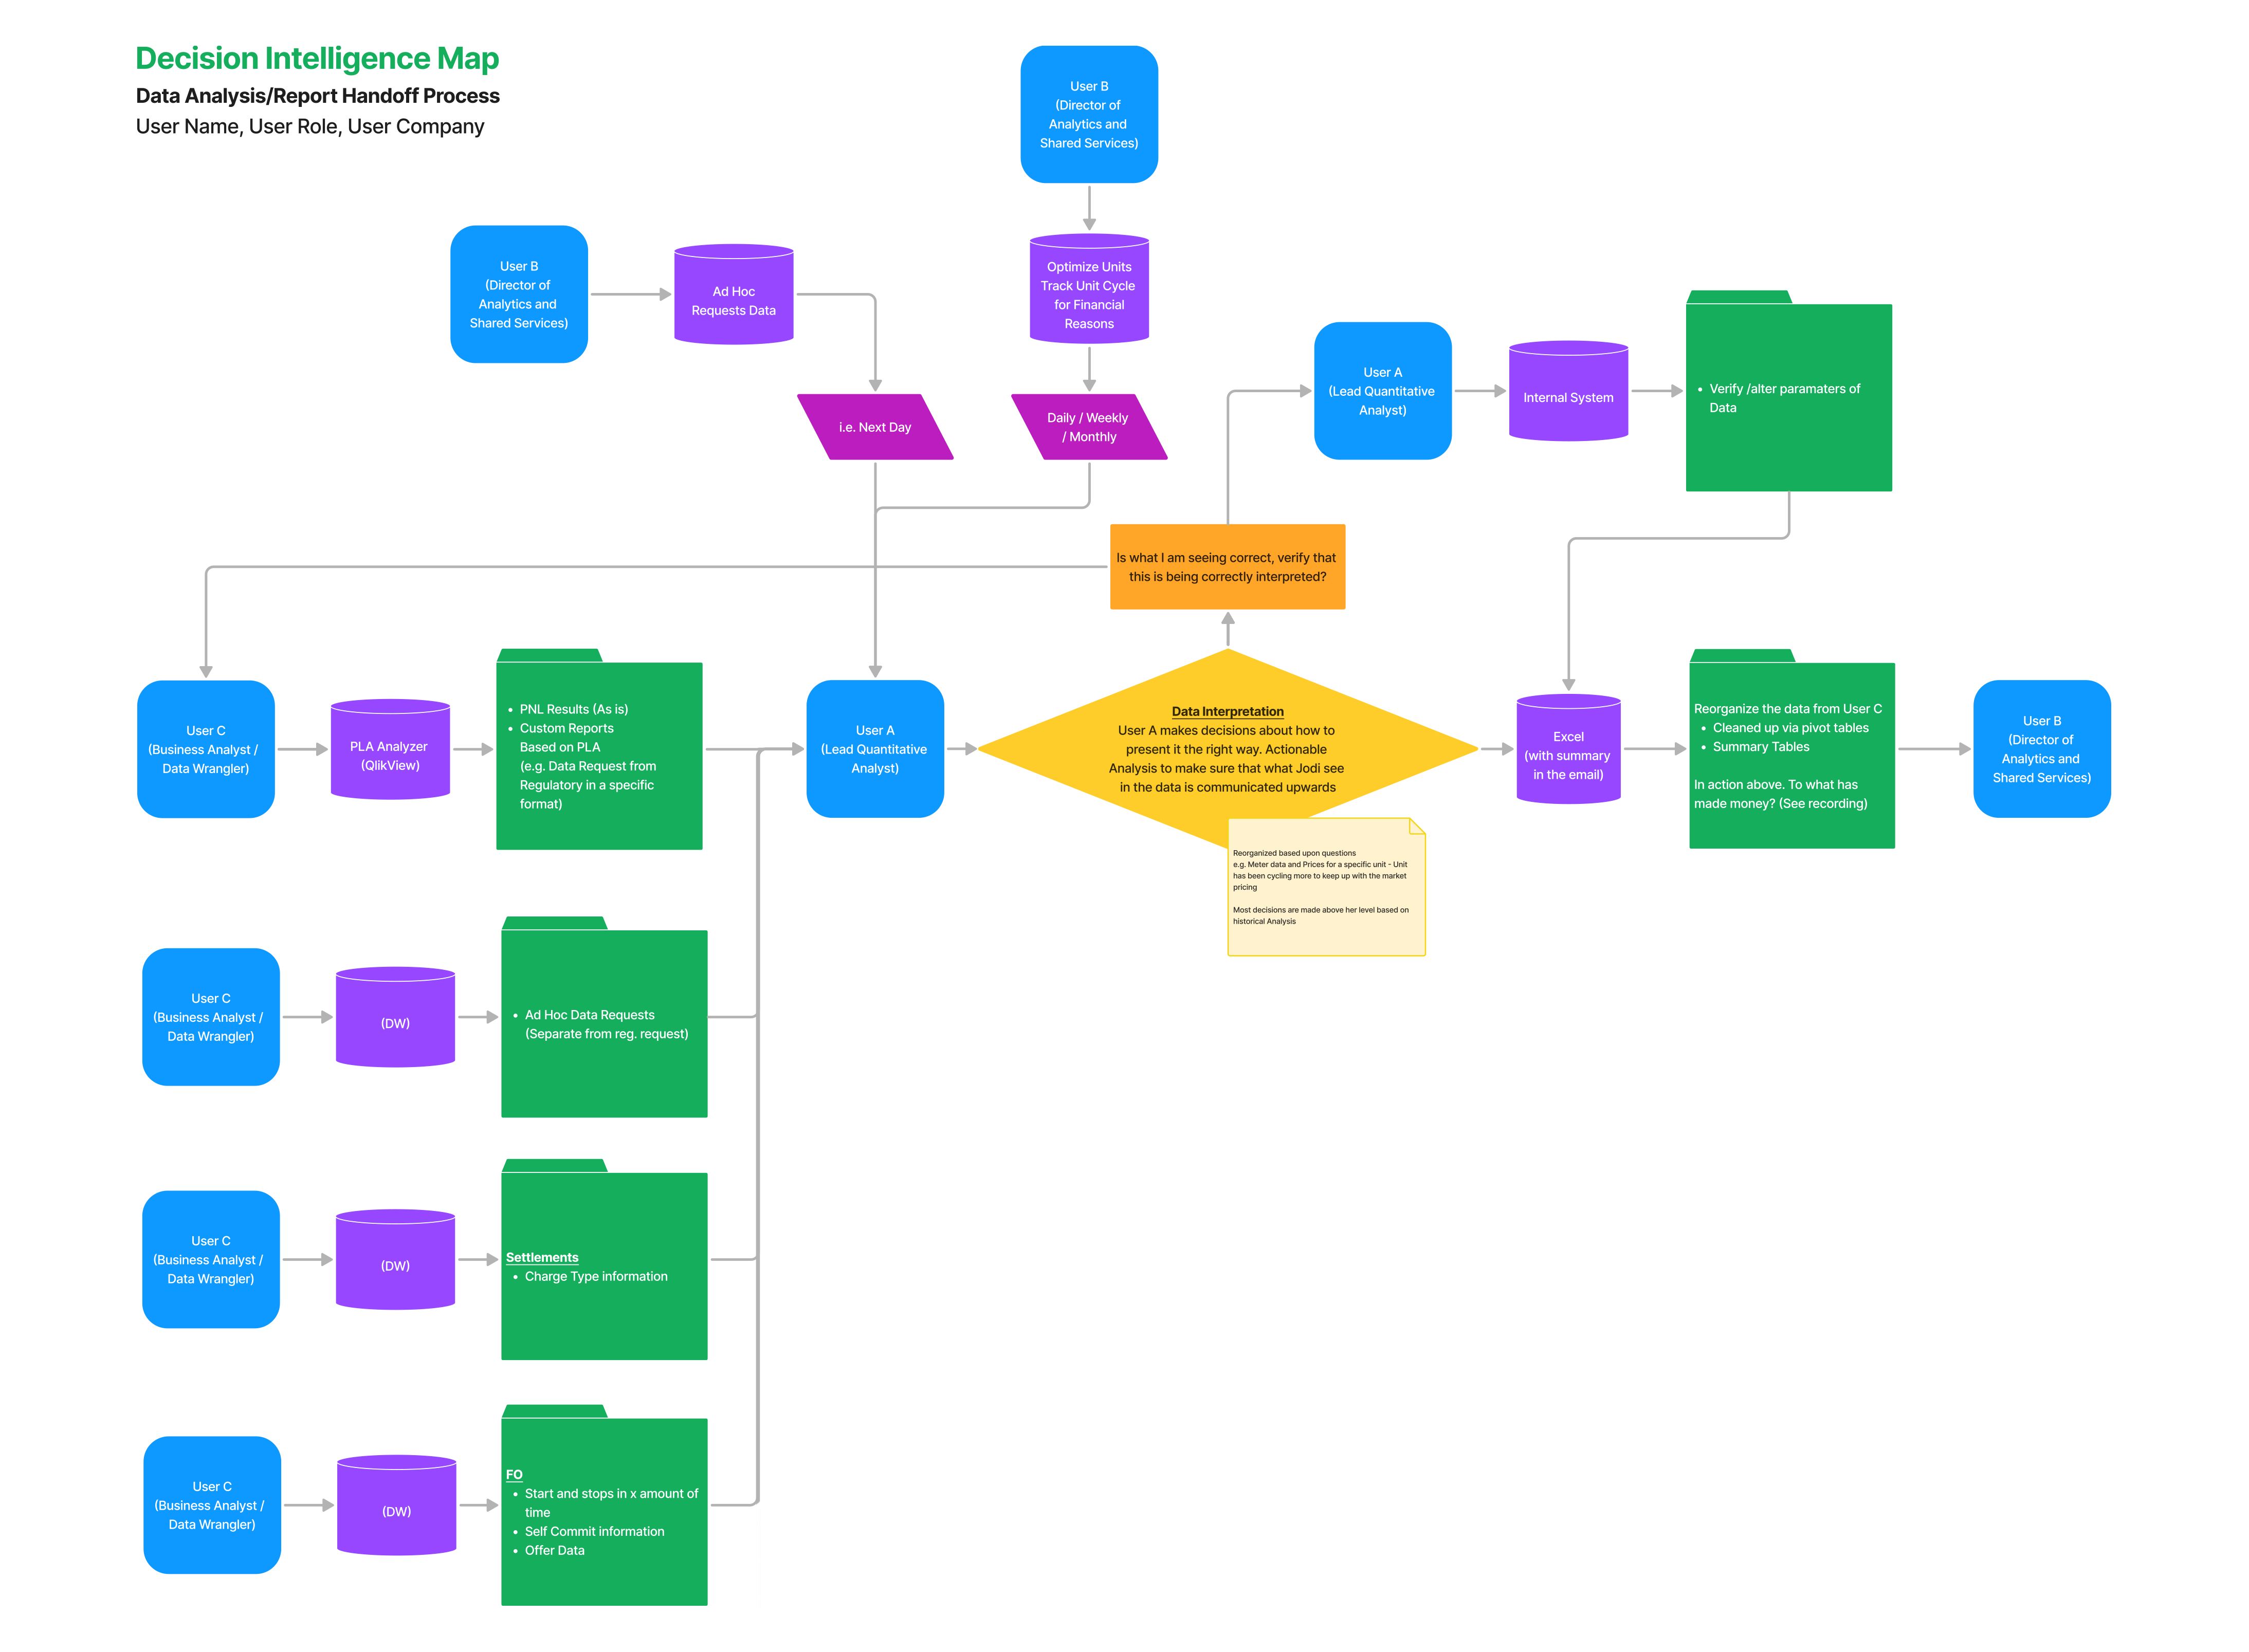
Goal: Gain deeper insights into business processes and decision-making workflows.

Building on user interviews, we conducted workflow mapping sessions to capture the specific steps users take to complete their tasks. Using interactive techniques like decision intelligence mapping and process Q&A, we examined how users make decisions, navigate reporting tools, and rely on competing products. These 30- to 60-minute sessions helped uncover workflow strengths and weaknesses, pinpointing areas where our solution could drive meaningful improvements.

Key Activities

  • Decision Intelligence Mapping: Analyzed user decision-making processes to inform smarter design solutions.
  • Business Process Q&A: Facilitated discussions to identify workflow bottlenecks and areas for optimization.
  • Competitive Analysis: Examined tools users rely on, highlighting pain points and potential advantages for our solution.

Outputs

  • Process Workflows & Decision Maps: Documented user workflows and decision paths for a clearer design strategy.
  • Recorded Videos & Notes: Captured key insights from users and stakeholders.
  • Competitive Analysis Insights: Revealed strengths, weaknesses, and gaps in competing tools.
  • Strategic Functionality Opportunities: Identified ways to deliver superior solutions and enhance usability.
CAISO Market Manager Headshot

“This is a great conversation; only good things can come out of this UX Research Process. You’re talking with customers about how they do things... a day-in-the-life. I think that insight will improve our relationship and get a better product for everyone.”

- Power Supply Technology Lead, EKPC
Phase 3

Customer Immersion

Video Montage

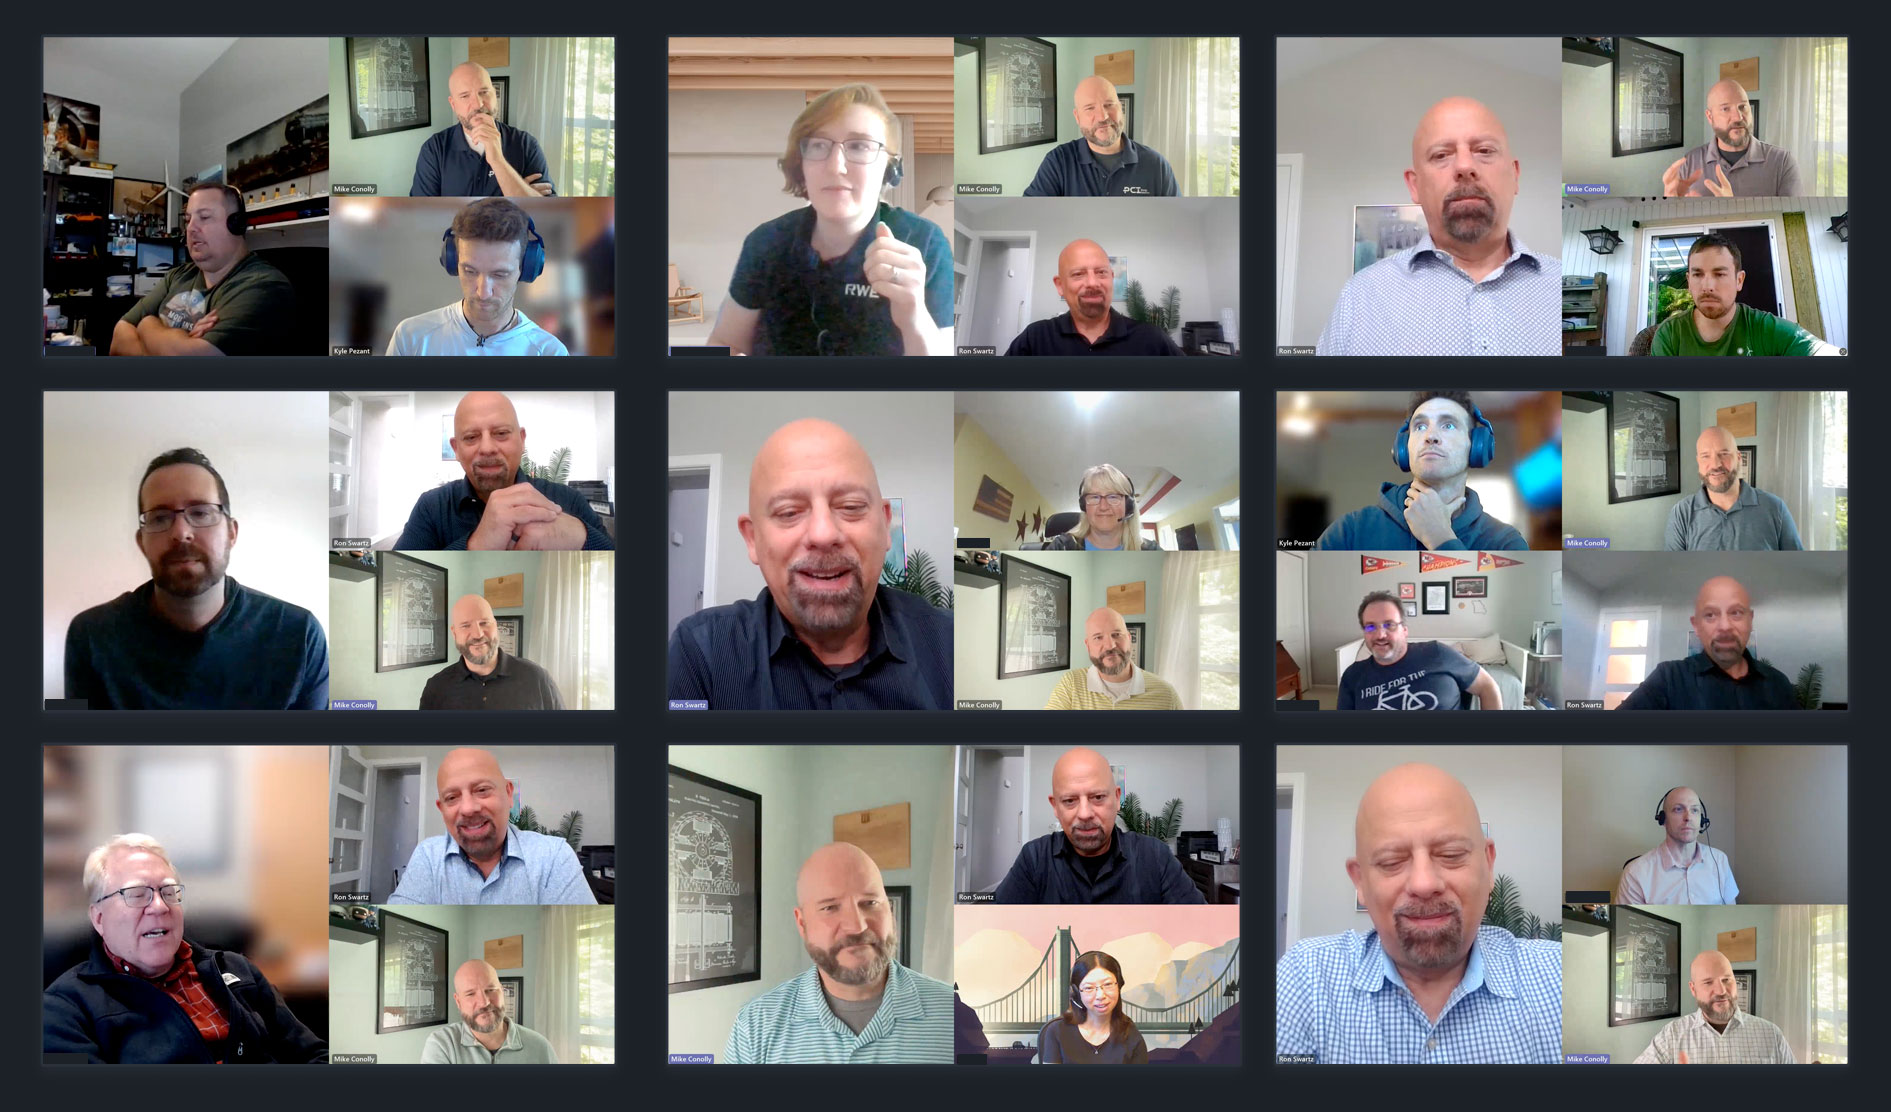
Goal: Immerse ourselves in their environment to deepen our understanding of users' challenges.

This phase took a hands-on approach, engaging with users both virtually and onsite to observe their daily workflows, system interactions, and collaboration dynamics. Over multiple days, we examined everything from the physical workspace setup to the software and hardware they relied on. This immersion provided valuable context beyond interviews, offering firsthand insights into real-world challenges. Additionally, we conducted market validation, gathering feedback on both our solution and competitor products to better align with user needs.

Key Activities

  • Contextual Observation: Studied users in their natural work environments to uncover workflow inefficiencies.
  • Collaboration Analysis: Examined team interactions and system dependencies to identify collaboration patterns.
  • Market Validation: Collected feedback on existing products and competitor offerings to refine our approach.

Outputs

  • Enhanced User Environment Insights: Developed a deeper understanding of how users interact with systems.
  • Updated Workflows & Decision Maps: Refined based on real-world observations.
  • Product Feedback: Gathered insights on user experiences with our solution and competitor tools.
  • Recorded Videos & Notes: Captured actionable findings to inform future design decisions.
CAISO Market Manager Headshot

“I take data from your system, from Settlecore, and CAISO Tools (Cyber, BSAP, Oasis, CMRI) and dump them into Excel. Then I use Excel to capture what I want to look at and put it into something that I can present to traders and others.”

- Senior Real Time Trader, PNM
CAISO Market Manager Headshot

“Automate as much as possible, remove all human interactions that don't inject intelligence if there's not a decision to be made. If a computer can the decison as well as a human, the computer should make it, period. For strategic decisions, that's where we want a human involved.”

- Manager of Merchant Systems, PSE
Phase 4

Solution Brainstorming

Solution Development Phases Graphic

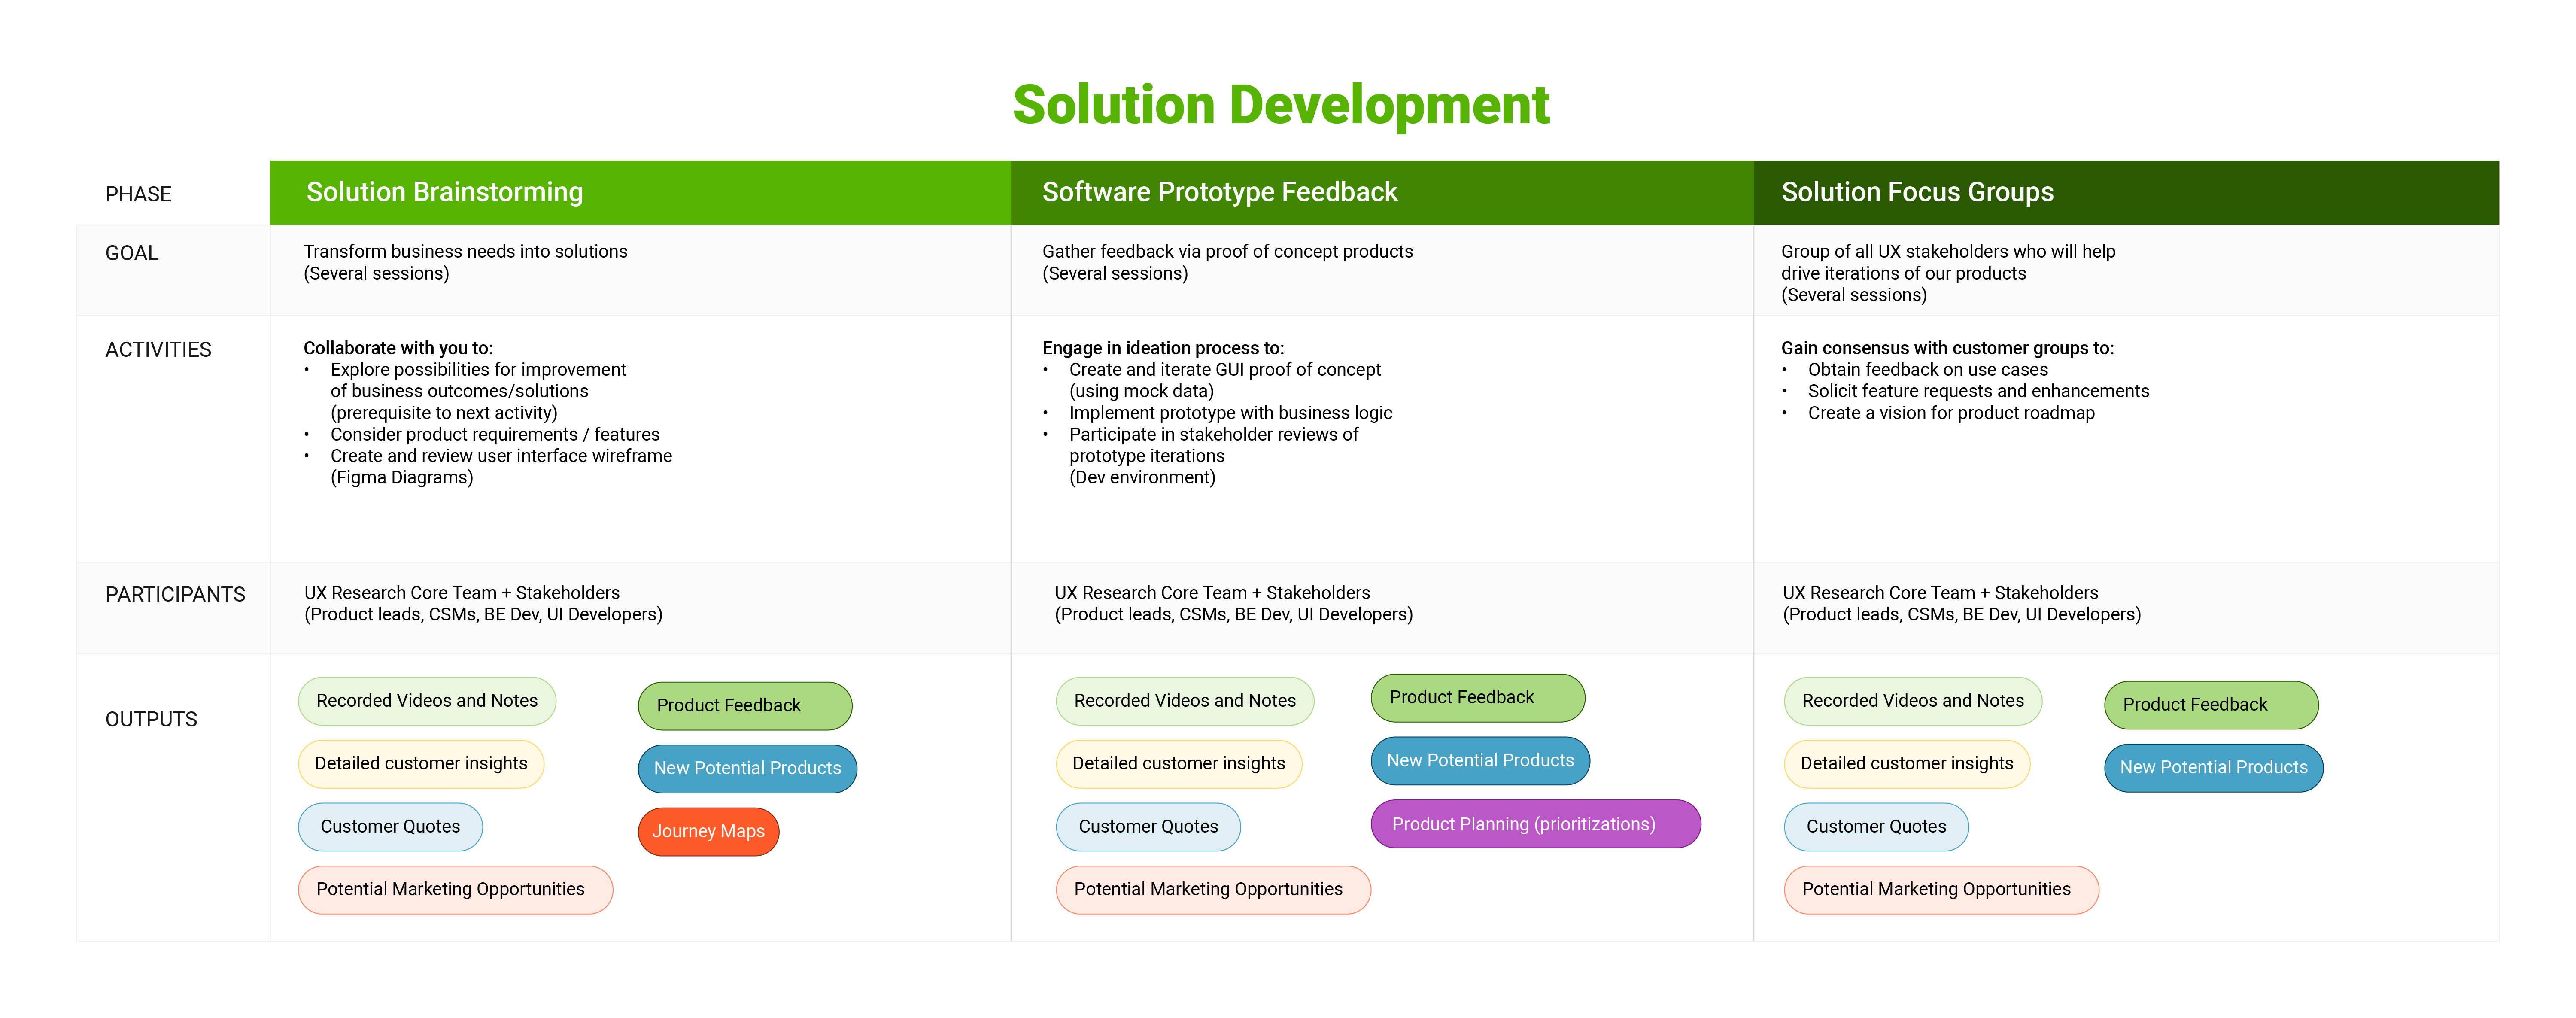
Goal: Brainstorm product solutions with stakeholders based on user needs and business goals.

With a deeper understanding of users and their workflows, we shifted to solution brainstorming, bringing together UX designers, product managers, CSMs, backend developers, and UI developers. Over multiple sessions, we explored ways to improve business outcomes, mapped out product features, and reviewed early user interface wireframes. Using Figma, we began translating insights from earlier research into initial design concepts, ensuring the solution was both practical and innovative.

Key Activities

  • Collaborative Ideation: Led brainstorming sessions to generate and refine potential solutions.
  • Wireframe Exploration: Reviewed early UI wireframes and feature concepts using Figma diagrams.
  • Stakeholder Alignment: Facilitated discussions to ensure product requirements aligned with user needs.

Outputs

  • Enhanced User Environment Insights: Developed a deeper understanding of how users interact with systems.
  • Updated Workflows & Decision Maps: Refined based on real-world observations.
  • Product Feedback: Gathered insights on user experiences with our solution and competitor tools.
  • Recorded Videos & Notes: Captured actionable findings to inform future design decisions.
Phase 5

Software Prototype Feedback

Building a Component
Building a Report

Goal: Validate the proposed solution through iterative feedback and prototypes.

With wireframes in place, we developed a functional prototype using mock data to test business logic and usability. This proof of concept allowed us to gather direct user and stakeholder feedback, ensuring the design aligned with business goals and user expectations. Through multiple review sessions, we iterated on the UI and user experience, refining functionality based on real-world insights.

Key Activities

  • Prototype Development: Created a GUI proof of concept to test design assumptions.
  • Iterative Design Reviews: Conducted prototype testing within a development environment to refine functionality.
  • Stakeholder Feedback Sessions: Engaged users and stakeholders to validate solutions and ensure product alignment.

Outputs

  • Recorded Feedback Sessions: Captured stakeholder insights for further refinements.
  • Prototype Feedback: Identified key areas for improvement and prioritization.
  • Product Planning Inputs: Aligned prototype adjustments with future development goals.
  • Refined Prototype: Improved alignment with user needs and expectations.
Phase 6

Solution Focus Groups

Insights Project Timeline

Goal: Gather input from UX stakeholders to drive product iterations and future enhancements.

In the final phase, we conducted focus groups with product leads, developers, and users to gain consensus on use cases, feature requests, and long-term improvements. These sessions ensured the product remained user-centered even post-launch, refining the product roadmap and shaping future iterations of the reporting and dashboard creator. By capturing ongoing feedback, we established a process for continuous enhancement and scalability.

Key Activities

  • Use Case Review: Presented real-world scenarios to gather stakeholder feedback.
  • Feature Ideation: Solicited feature requests and improvement ideas to address evolving user needs.
  • Consensus Building: Facilitated discussions to prioritize roadmap development and align on next steps.

Outputs

  • Feature Requests & Enhancements: Identified new functionality and user-driven priorities.
  • Updated Journey Maps: Reflected feedback-driven design refinements.
  • Product Roadmap Revisions: Integrated focus group insights to shape future iterations.
Bringing It All Together

Conclusion

Our six-phase UX research process ensured that the new reporting and dashboard solution was built on real user insights, business needs, and competitive analysis. By conducting in-depth interviews and immersing ourselves in users' environments, we identified key pain points and transformed them into practical design solutions.

Through continuous collaboration with stakeholders and iterative feedback, we created a product that not only met business goals but also delivered an intuitive, functional, and user-friendly experience. The result is a seamless reporting and dashboard tool that fits naturally into users’ workflows, empowering them with efficiency, clarity, and ease of use.