Insights
Revolutionizing Data Reporting in the Energy Industry

When the company launched its first offering nearly 30 years ago, it was a niche software platform tailored to a small segment of the energy industry. Over time, new products were introduced, transforming the company into a multi-tier enterprise software solution. However, this rapid expansion, primarily led by engineers and developers, introduced significant usability challenges.
As the company scaled, silos in software development emerged, with different teams working independently on various products. Without cross-functional collaboration, each group built solutions in isolation, leading to divergent design patterns, inconsistent user flows, and fragmented experiences. The lack of a cohesive design strategy meant that products evolved separately, often prioritizing functionality over usability. As a result, users faced unreliable and inefficient workflows, struggling to navigate an ecosystem that lacked standardized interaction models.
This fragmentation became particularly evident in data management and reporting workflows. Users were often forced to manually update data, refresh pages, or run additional processes to ensure changes were properly reflected. These inefficiencies led to instability, errors, and frustration, ultimately affecting productivity and decision-making. Without a unified approach to UX and system architecture, the software became increasingly difficult to scale and maintain.
Goal: Build a centralized, intuitive solution to simplify managing fragmented reporting tools.
Given a tight one-year deadline, we prioritized building a platform that was scalable, flexible, and user-friendly. Our mission was to deliver a reporting platform that was not just functional but transformative and empowered users to easily customize their data views and generate reports without extensive training or workarounds.

“We are sitting on tons of unorganized raw data. The challenge is for us to provide insights to customers that help them operate their business more effectively.”
Our initial UX research focused on engaging with internal subject matter experts (SMEs) to understand existing products and capabilities. Structured interviews and collaborative sessions highlighted critical pain points, such as fragmented workflows, inconsistent data accessibility, and complex reporting processes.
This foundational research provided a comprehensive understanding of the ecosystem, revealing strengths like robust data integrations and analytics while identifying usability gaps. These insights shaped ambitious goals to not only address weaknesses but also reimagine the user experience.

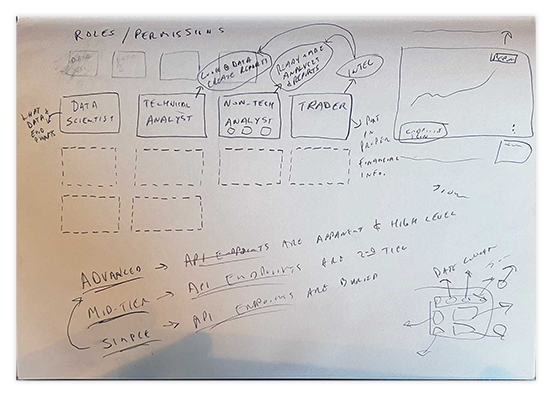
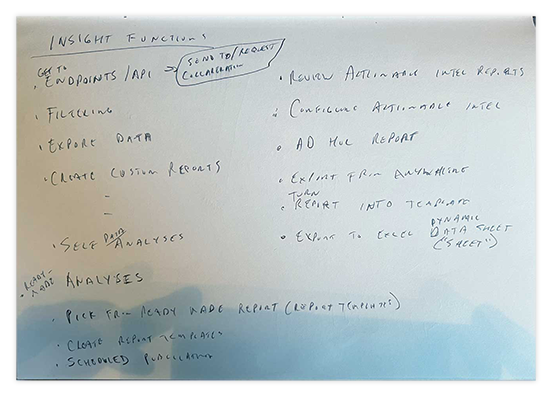
Through a rigorous UX research process, including decision intelligence mapping, contextual inquiries, and in-depth discussions with users, we gained a clear understanding of the challenges they faced daily. This approach allowed us to map their workflows from upstream to downstream, highlighting the systems and tools they used, the decisions they made, and how they navigated complex processes. Observing users in their natural environments revealed critical inefficiencies in handling fragmented data and disjointed tools.
We also conducted participatory design exercises where users outlined their ideal workflows and identified key frustrations. These sessions provided actionable insights into inefficiencies such as manual processes and data silos that hindered productivity and scalability. These findings laid the groundwork for defining our design priorities, ensuring we tackled both immediate pain points and long-term needs.

Thorough UX research enriches the design process, driving meaningful innovation and ensuring that the solutions we create truly align with the needs of those who use them. Without it, the design process may miss key insights that are vital for creating impactful and user-centered experiences.
I’ve written a separate detailed UX research project outlining the process we used for this project.
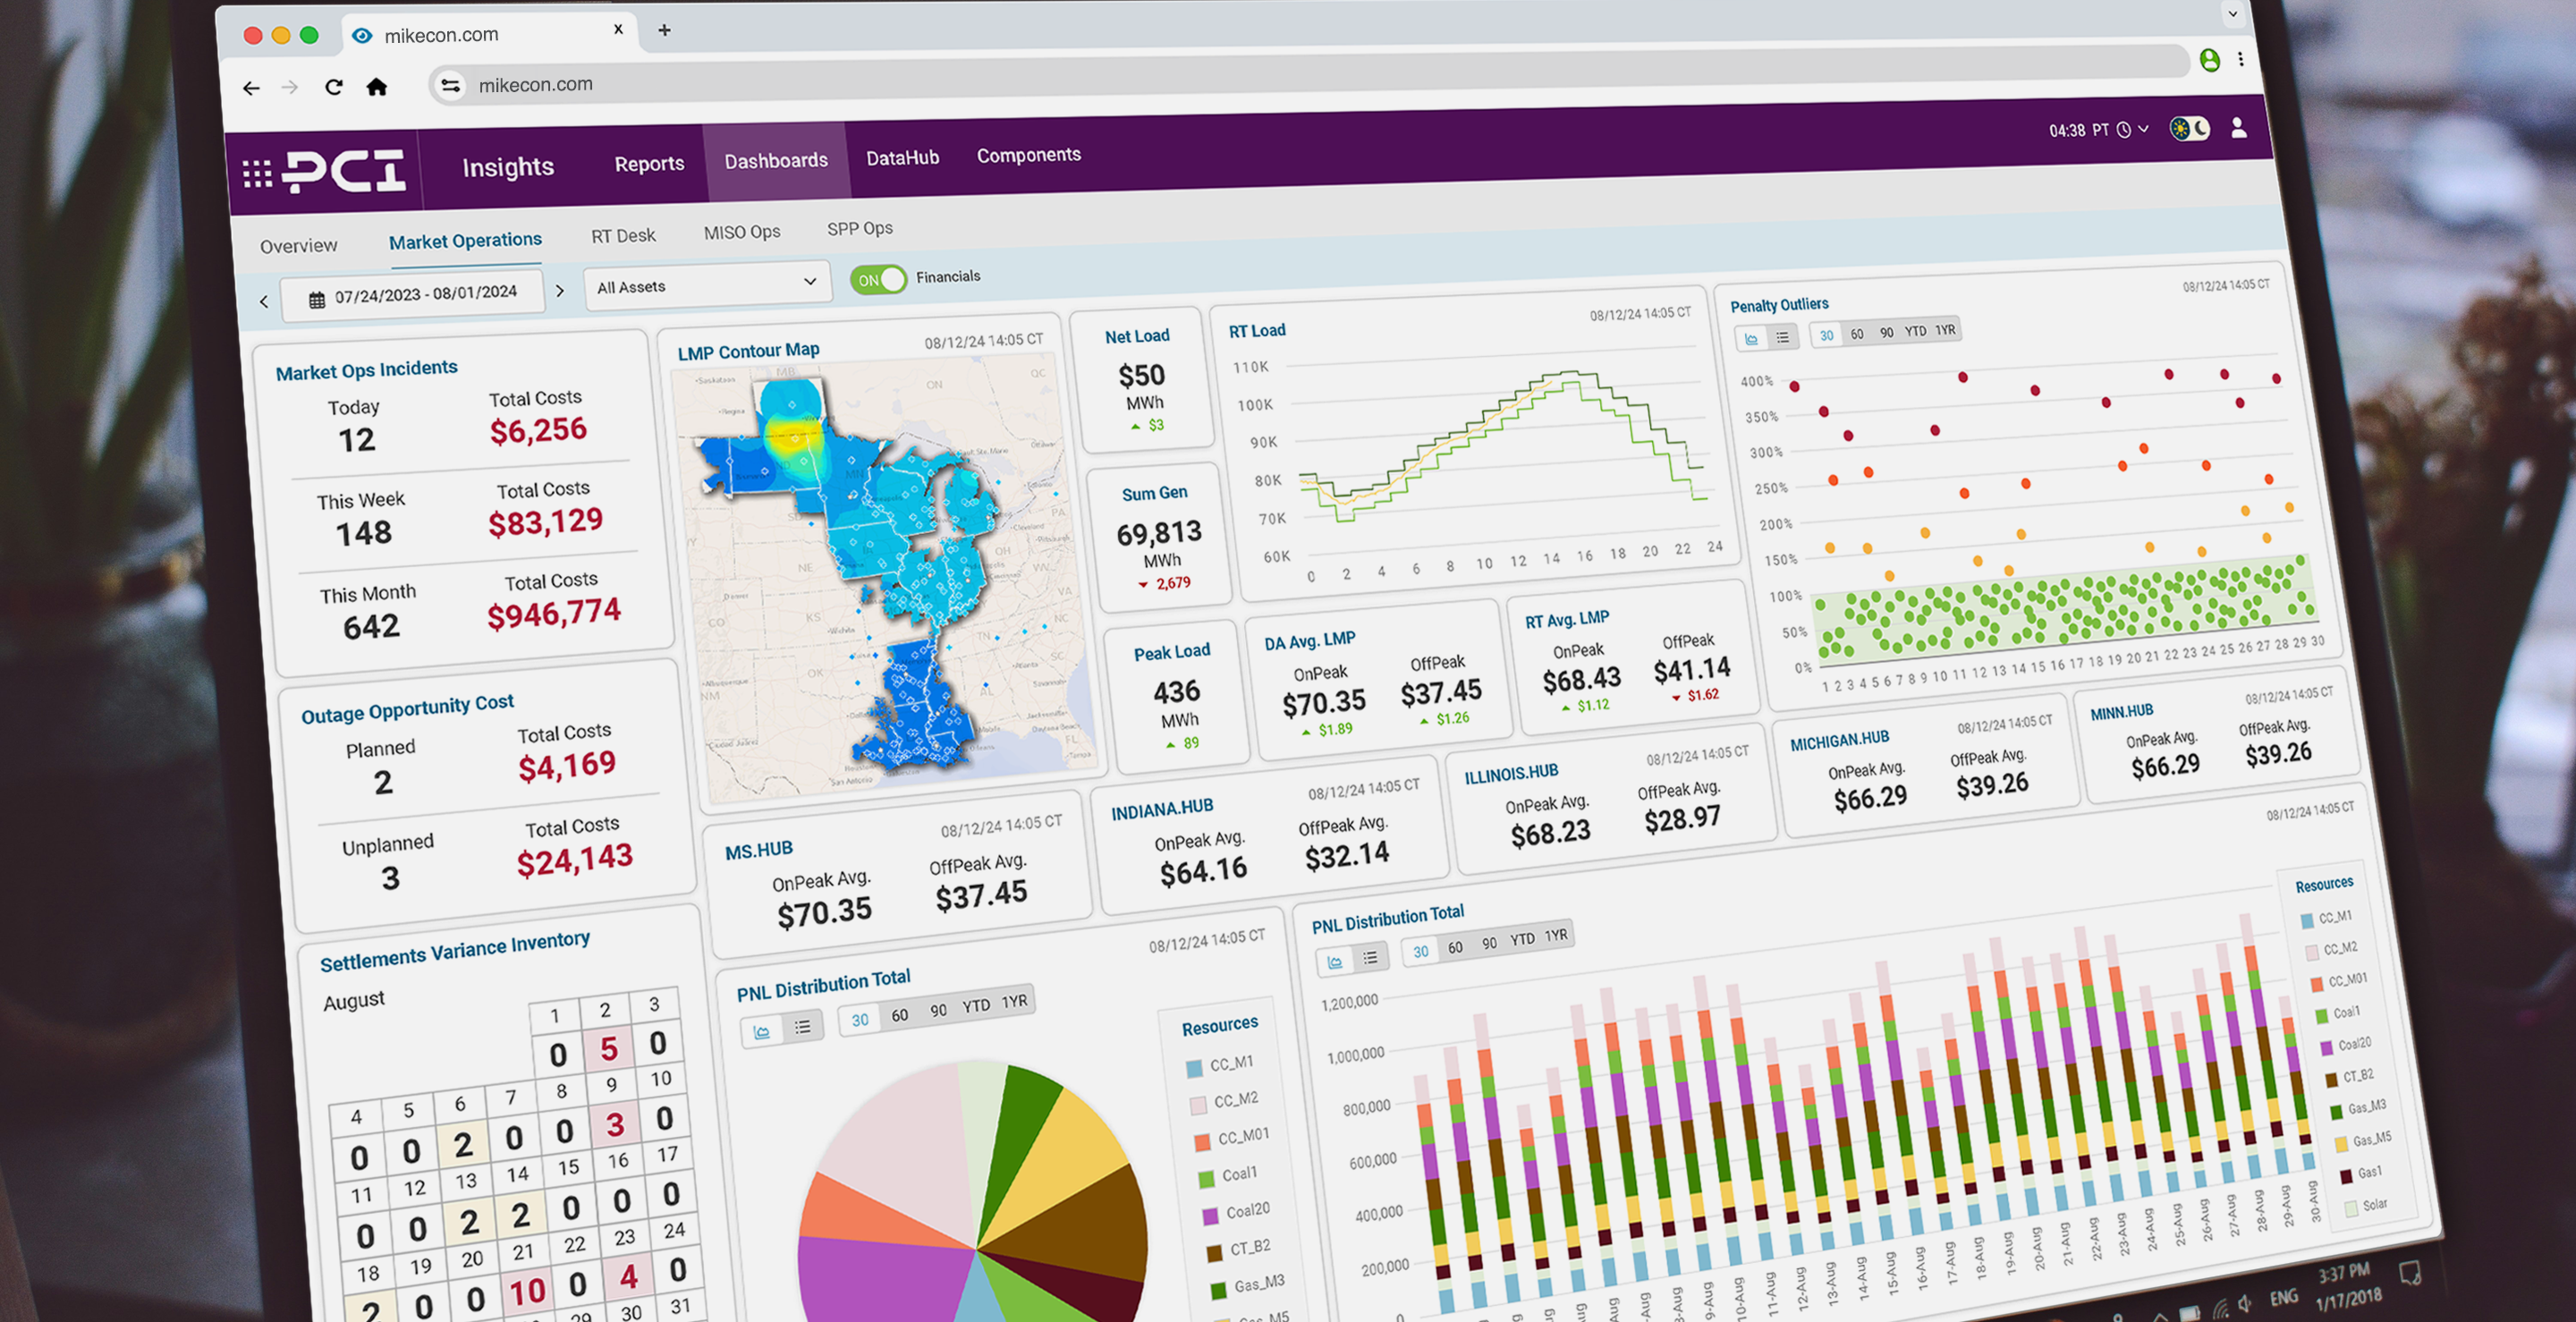
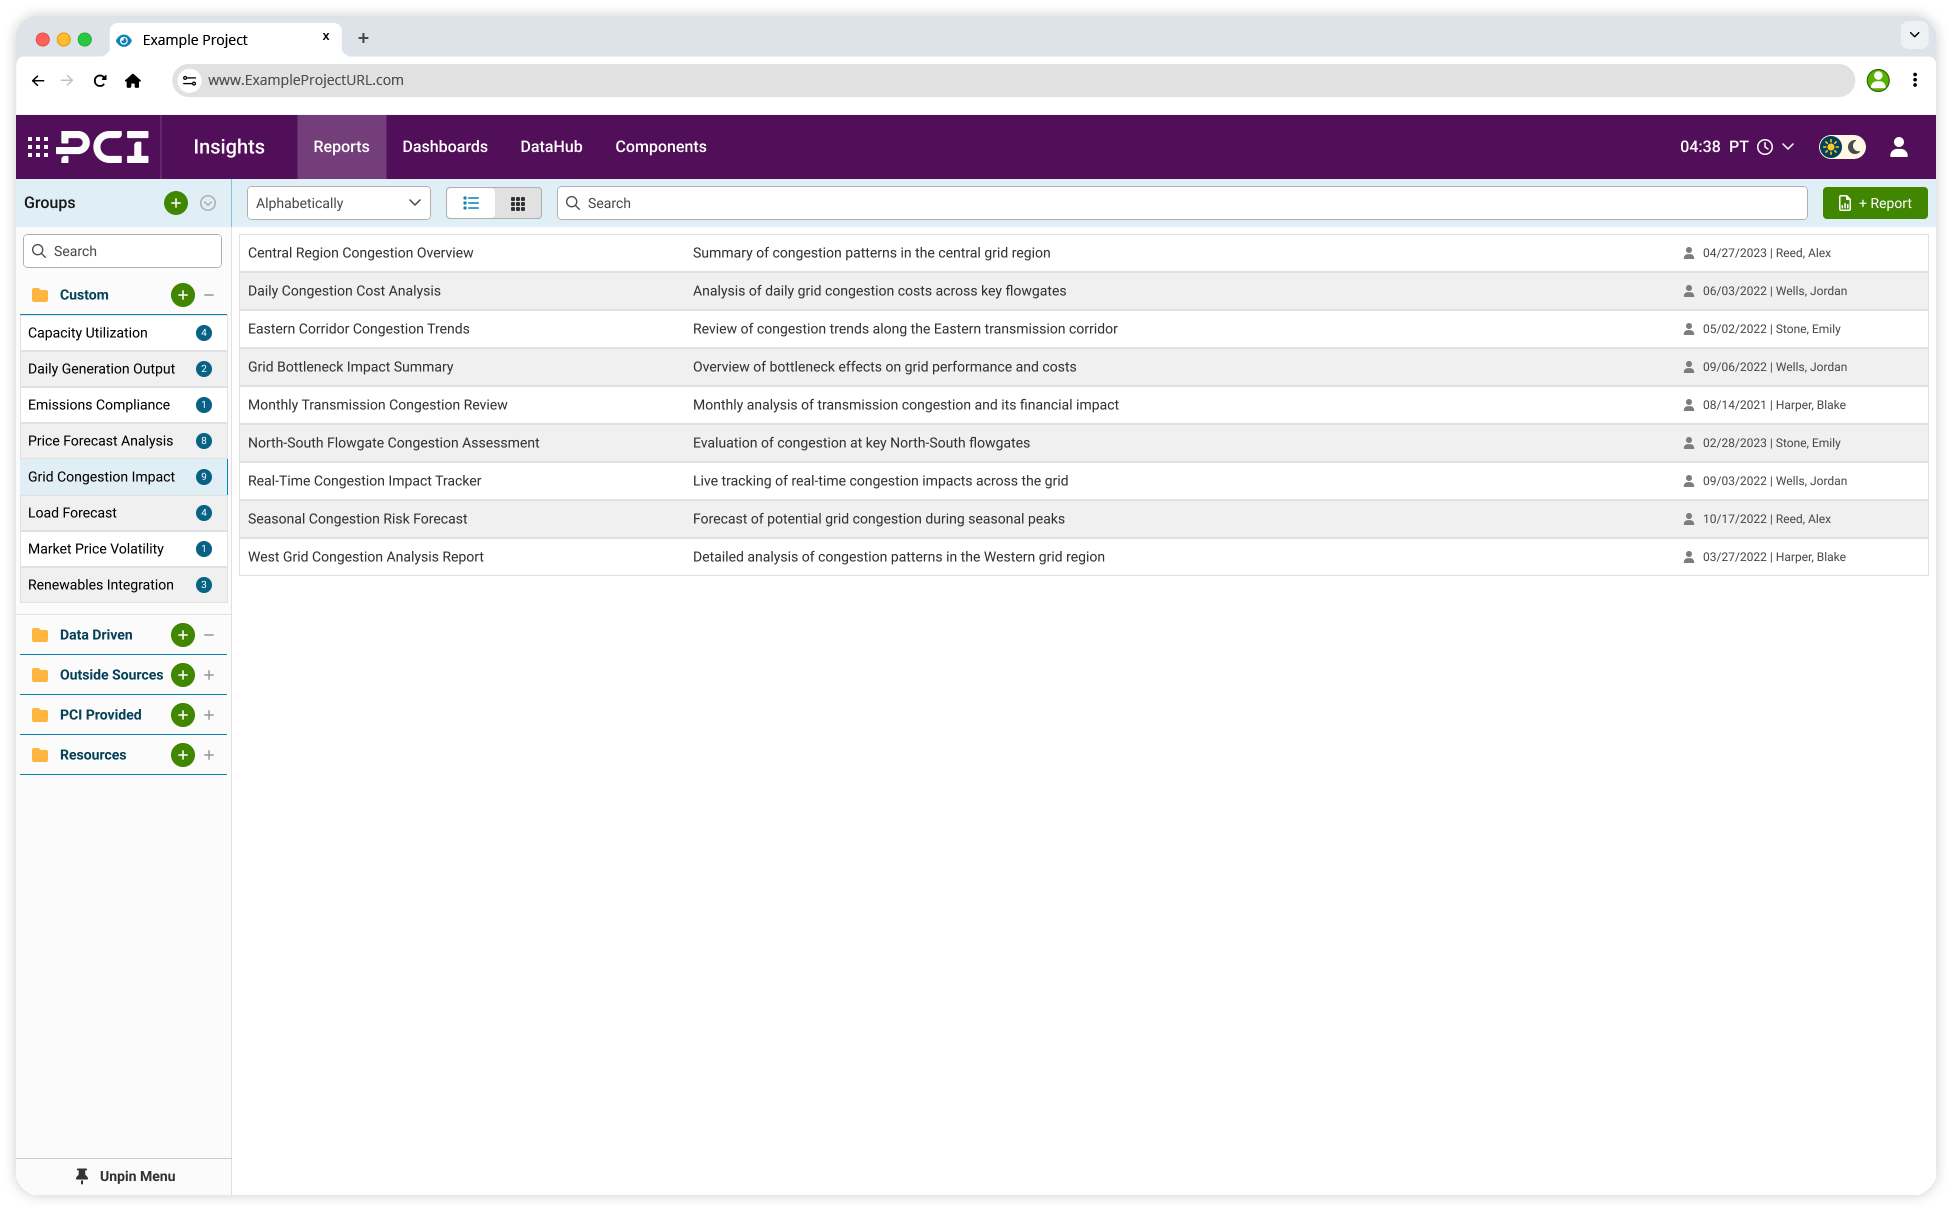
Following the initial UX research phases, our analysis highlighted the need for a flexible, reusable, and user-centric design process. Initially, the focus was on creating a powerful reporting tool to address user frustrations with fragmented workflows. However, as the design evolved, we saw an opportunity to expand the platform’s capabilities. The modular components built for reports could also be repurposed for real-time, dynamic dashboards, giving users the tools to monitor key information and make informed decisions throughout their day. This led to the creation of Insights, a cohesive product integrating reporting and dashboard tools into a single platform.
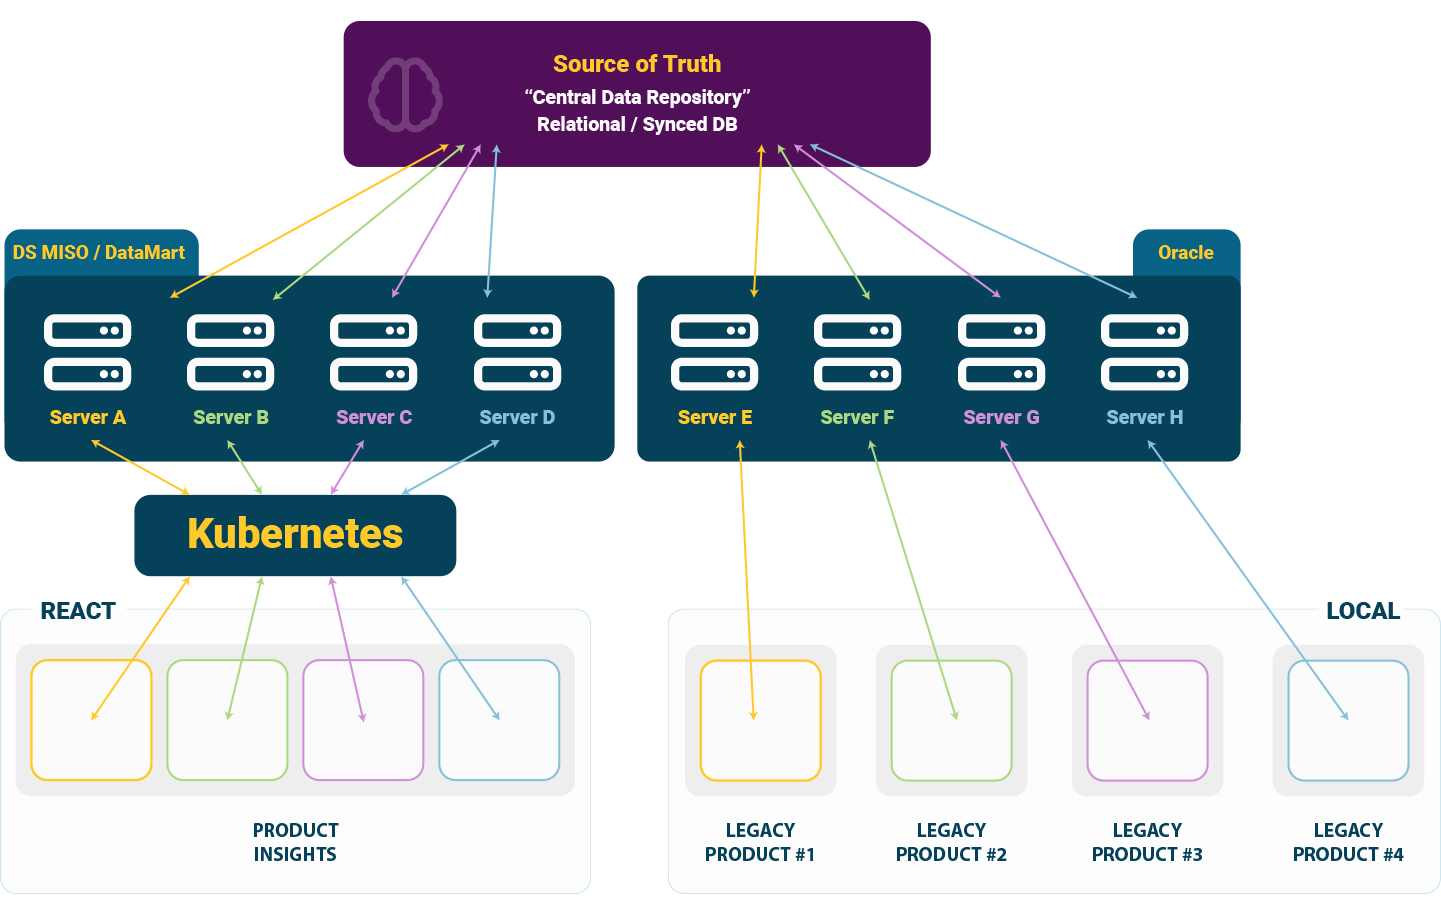
User research also revealed that some customers preferred accessing data through external tools like Tableau or Power BI. These users wanted to extract and transform data into their own business intelligence (BI) tools. This insight drove us to design Insights with seamless data export and integration, ensuring flexibility for diverse workflows.
At the core of Insights was component-driven design, a system of reusable, modular components that allowed users to tailor dashboards and reports while maintaining consistency and scalability. This approach not only ensured a cohesive user experience but also accelerated development, making it easier to introduce new features and adapt to evolving customer needs.
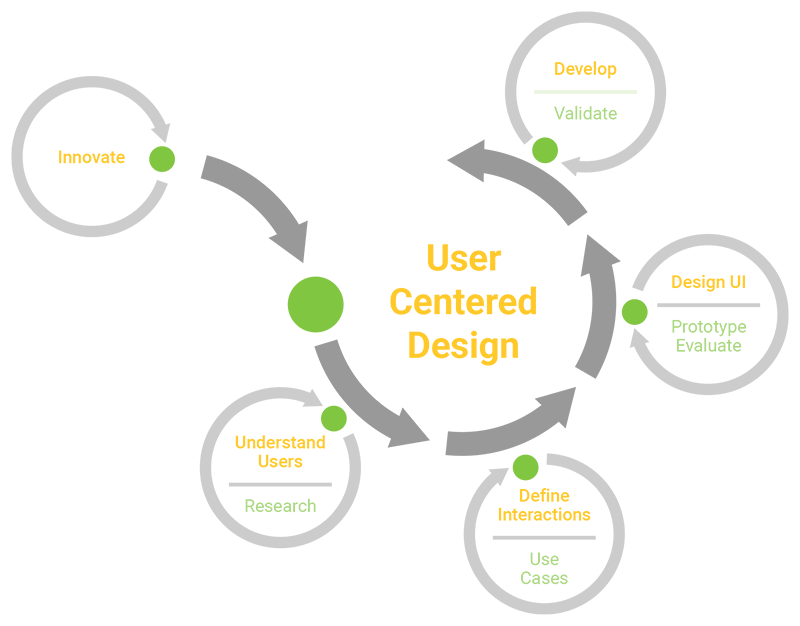
The success of the Insights platform was built on an iterative design process that prioritized user input, cross-functional collaboration, and ongoing refinement. This method ensured that each design decision was thoughtfully aligned with user needs, business goals, and technical feasibility.
By embracing an iterative approach, we minimized risk, optimized workflows, and delivered a polished product within the constraints of a tight one-year timeline.
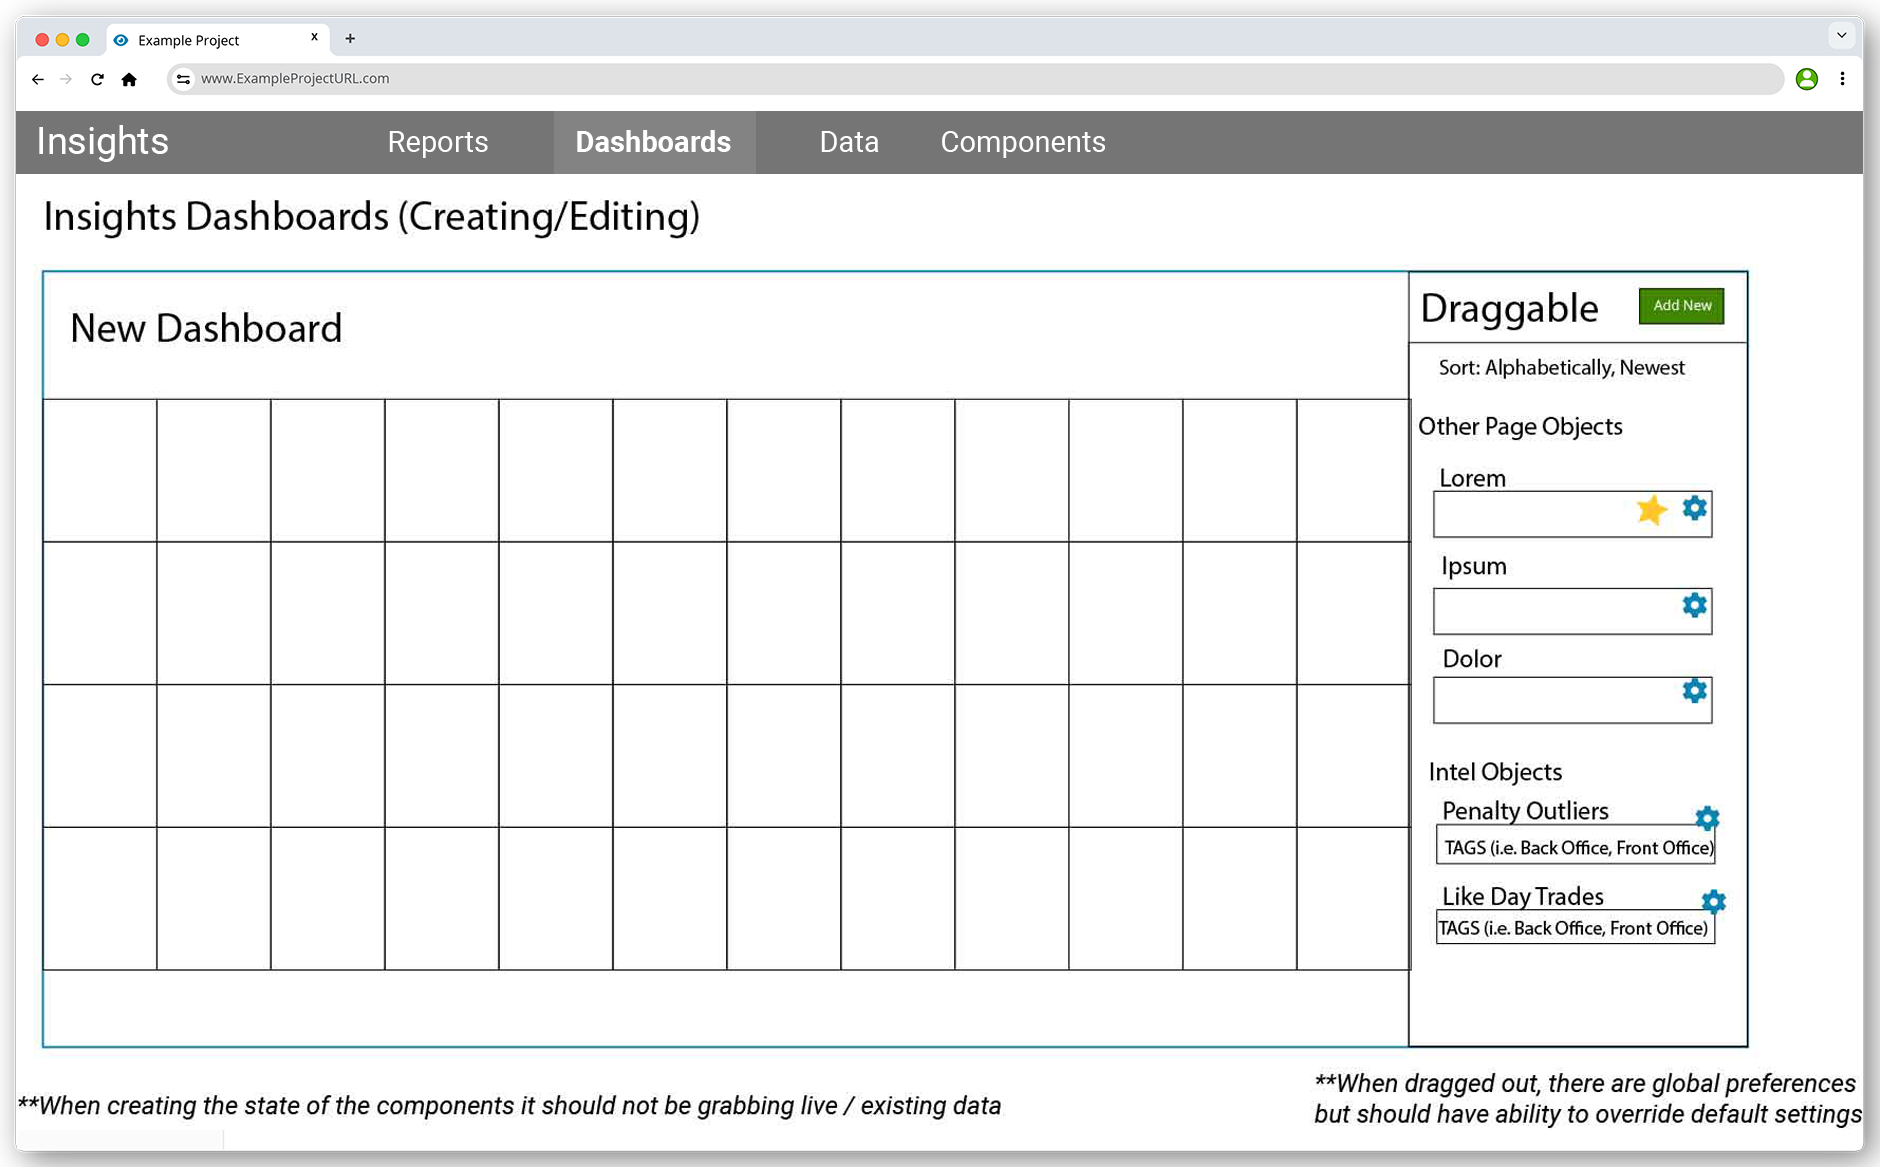
Wireframes enabled rapid iteration, allowing stakeholders and SMEs to validate structure early. Feedback identified workflow bottlenecks, leading to refinements before moving to higher fidelity.
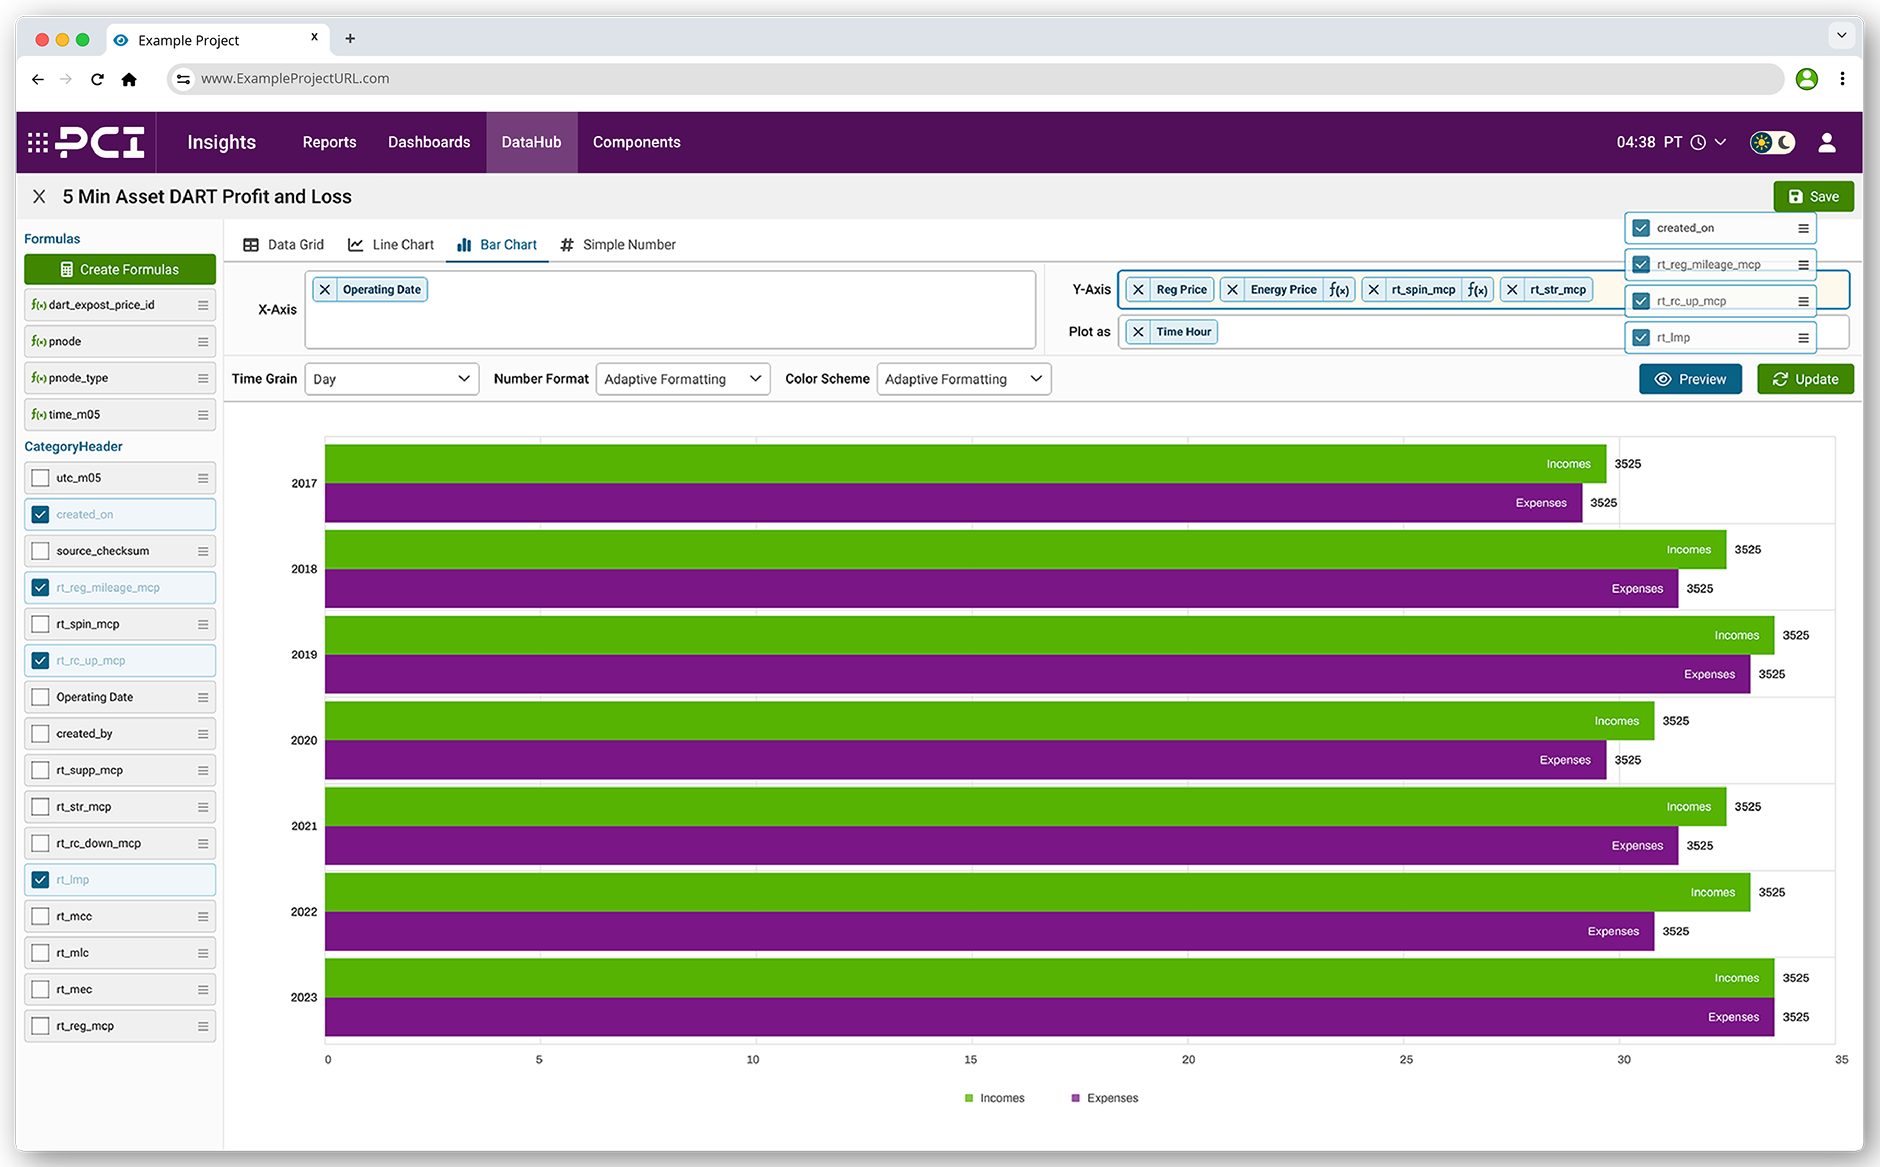
After validating wireframes, we transitioned to interactive prototypes that simulated real user interactions.
Continuous feedback was at the heart of our iterative design approach. Each iteration was informed by insights gathered from key stakeholders and end-users, ensuring the design evolved based on real needs.
By the end of the process, more than a dozen iterations had been completed for core workflows, resulting in a highly polished, user-friendly platform.
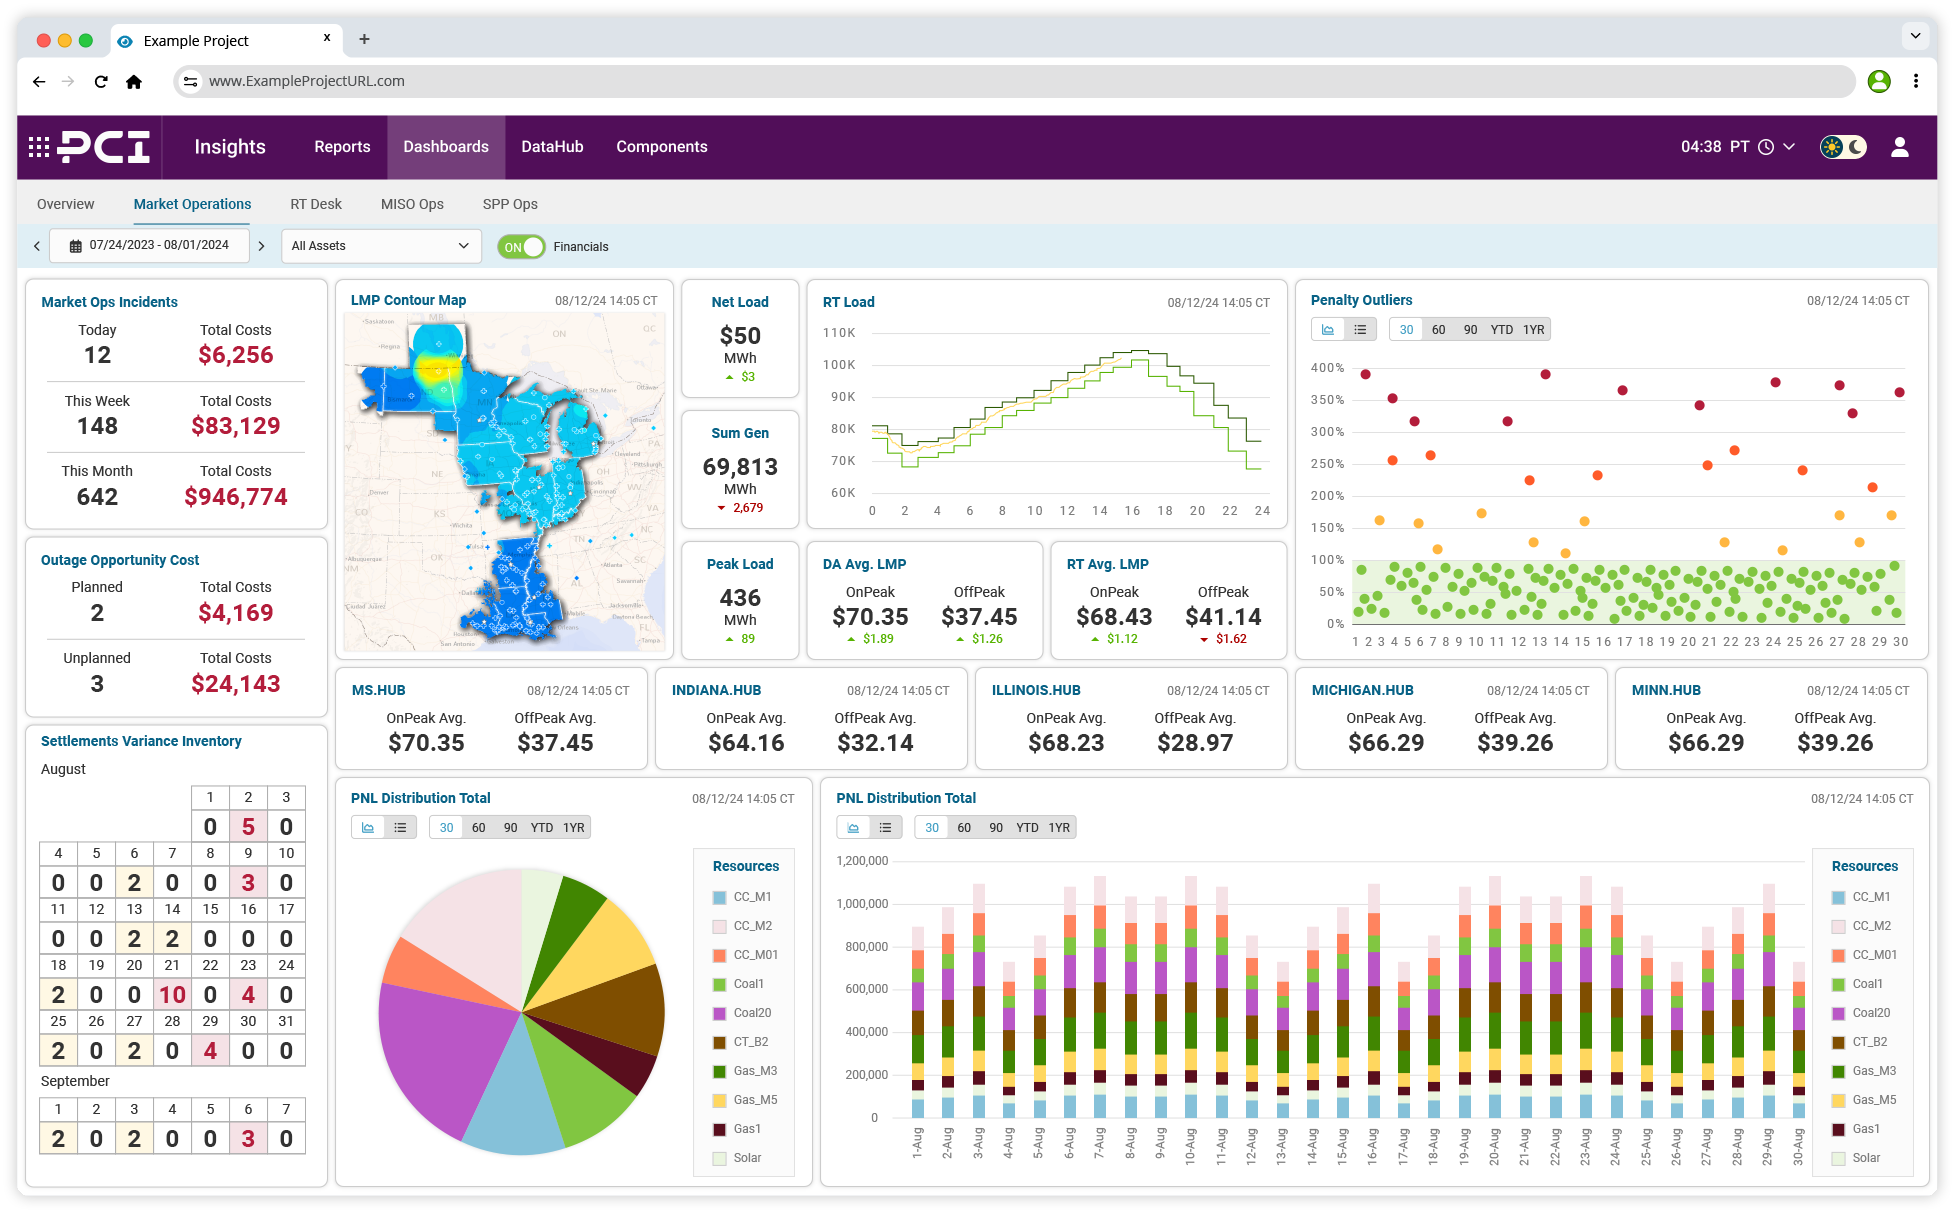
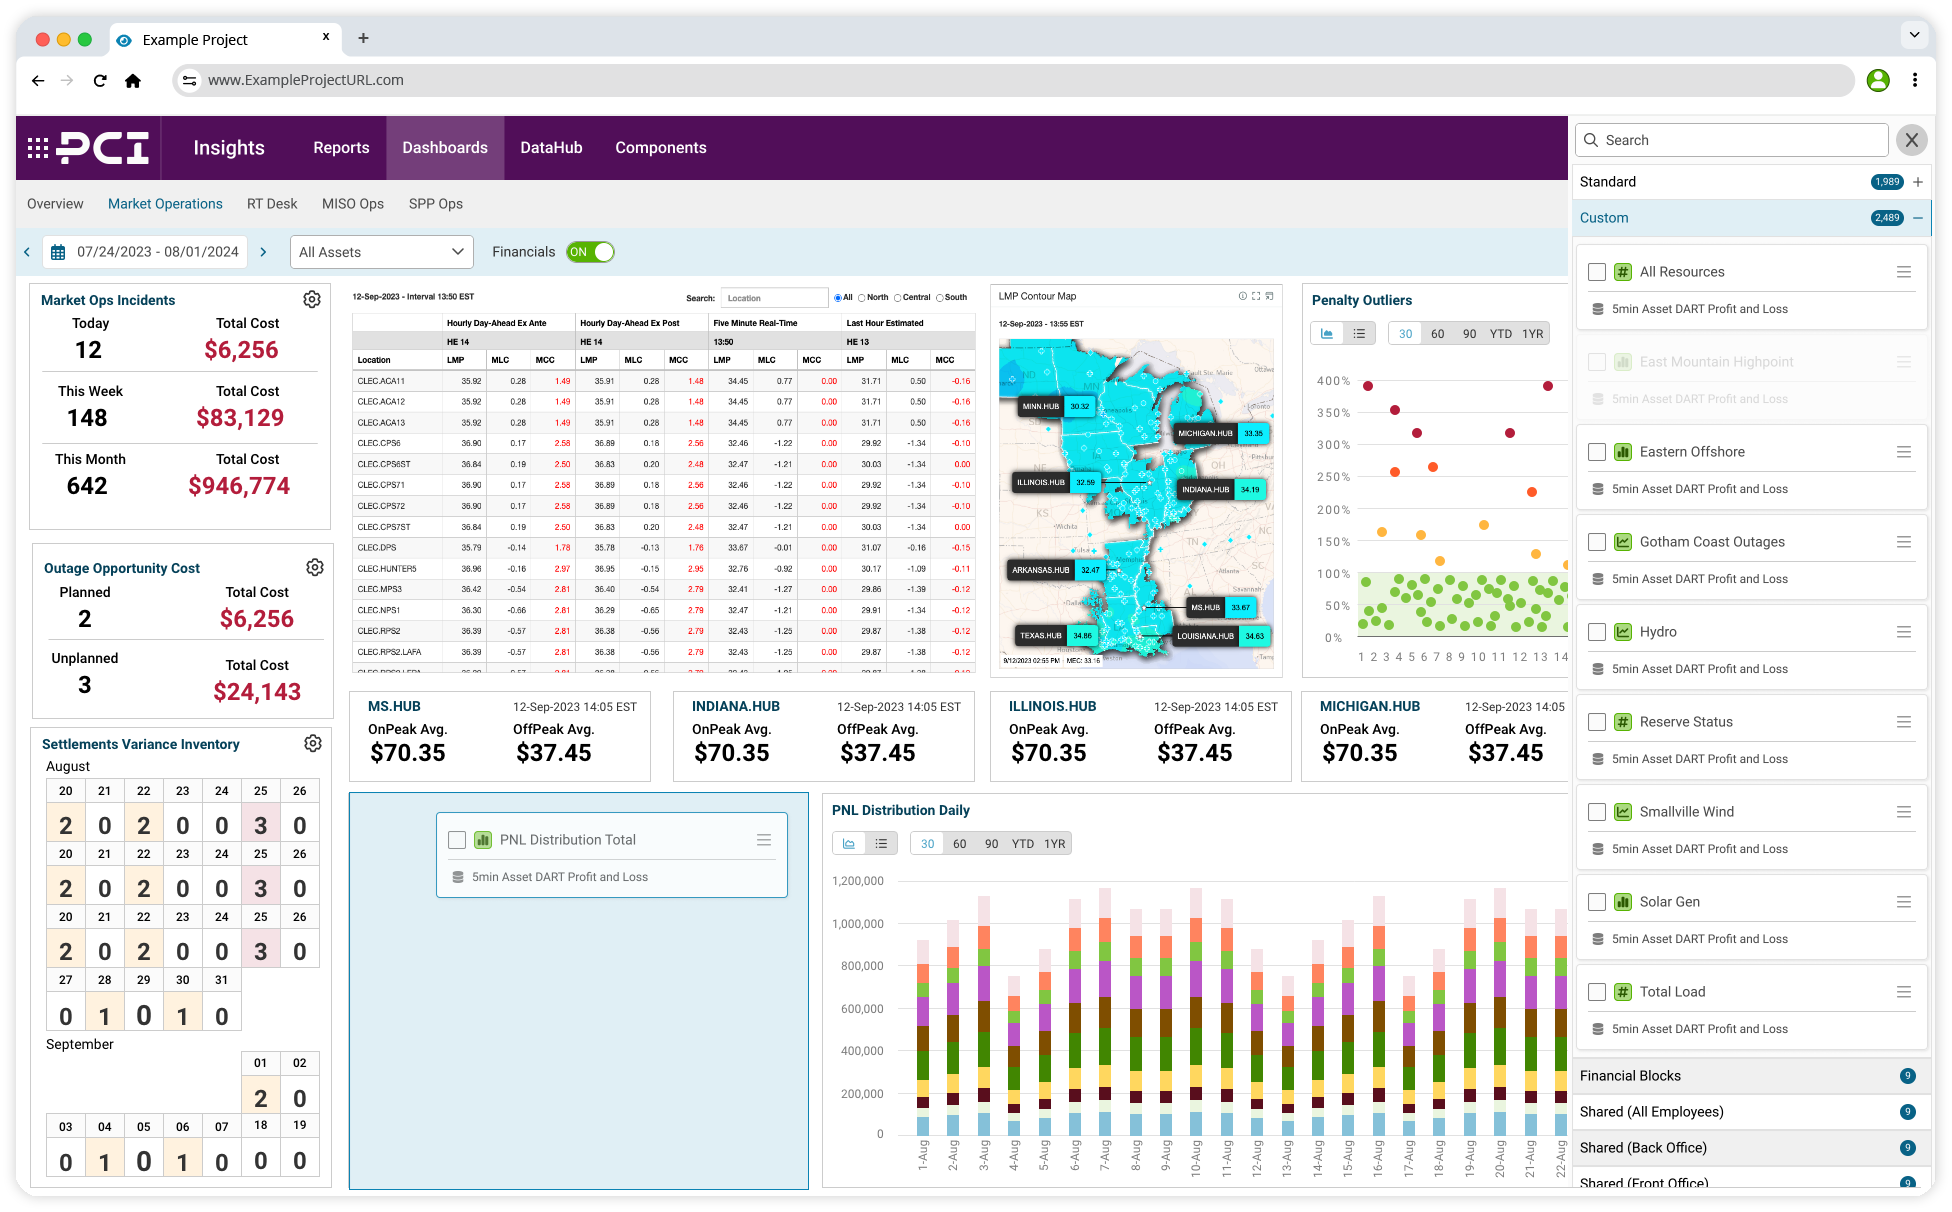
Drag and drop components like charts, KPI widgets, and filters.
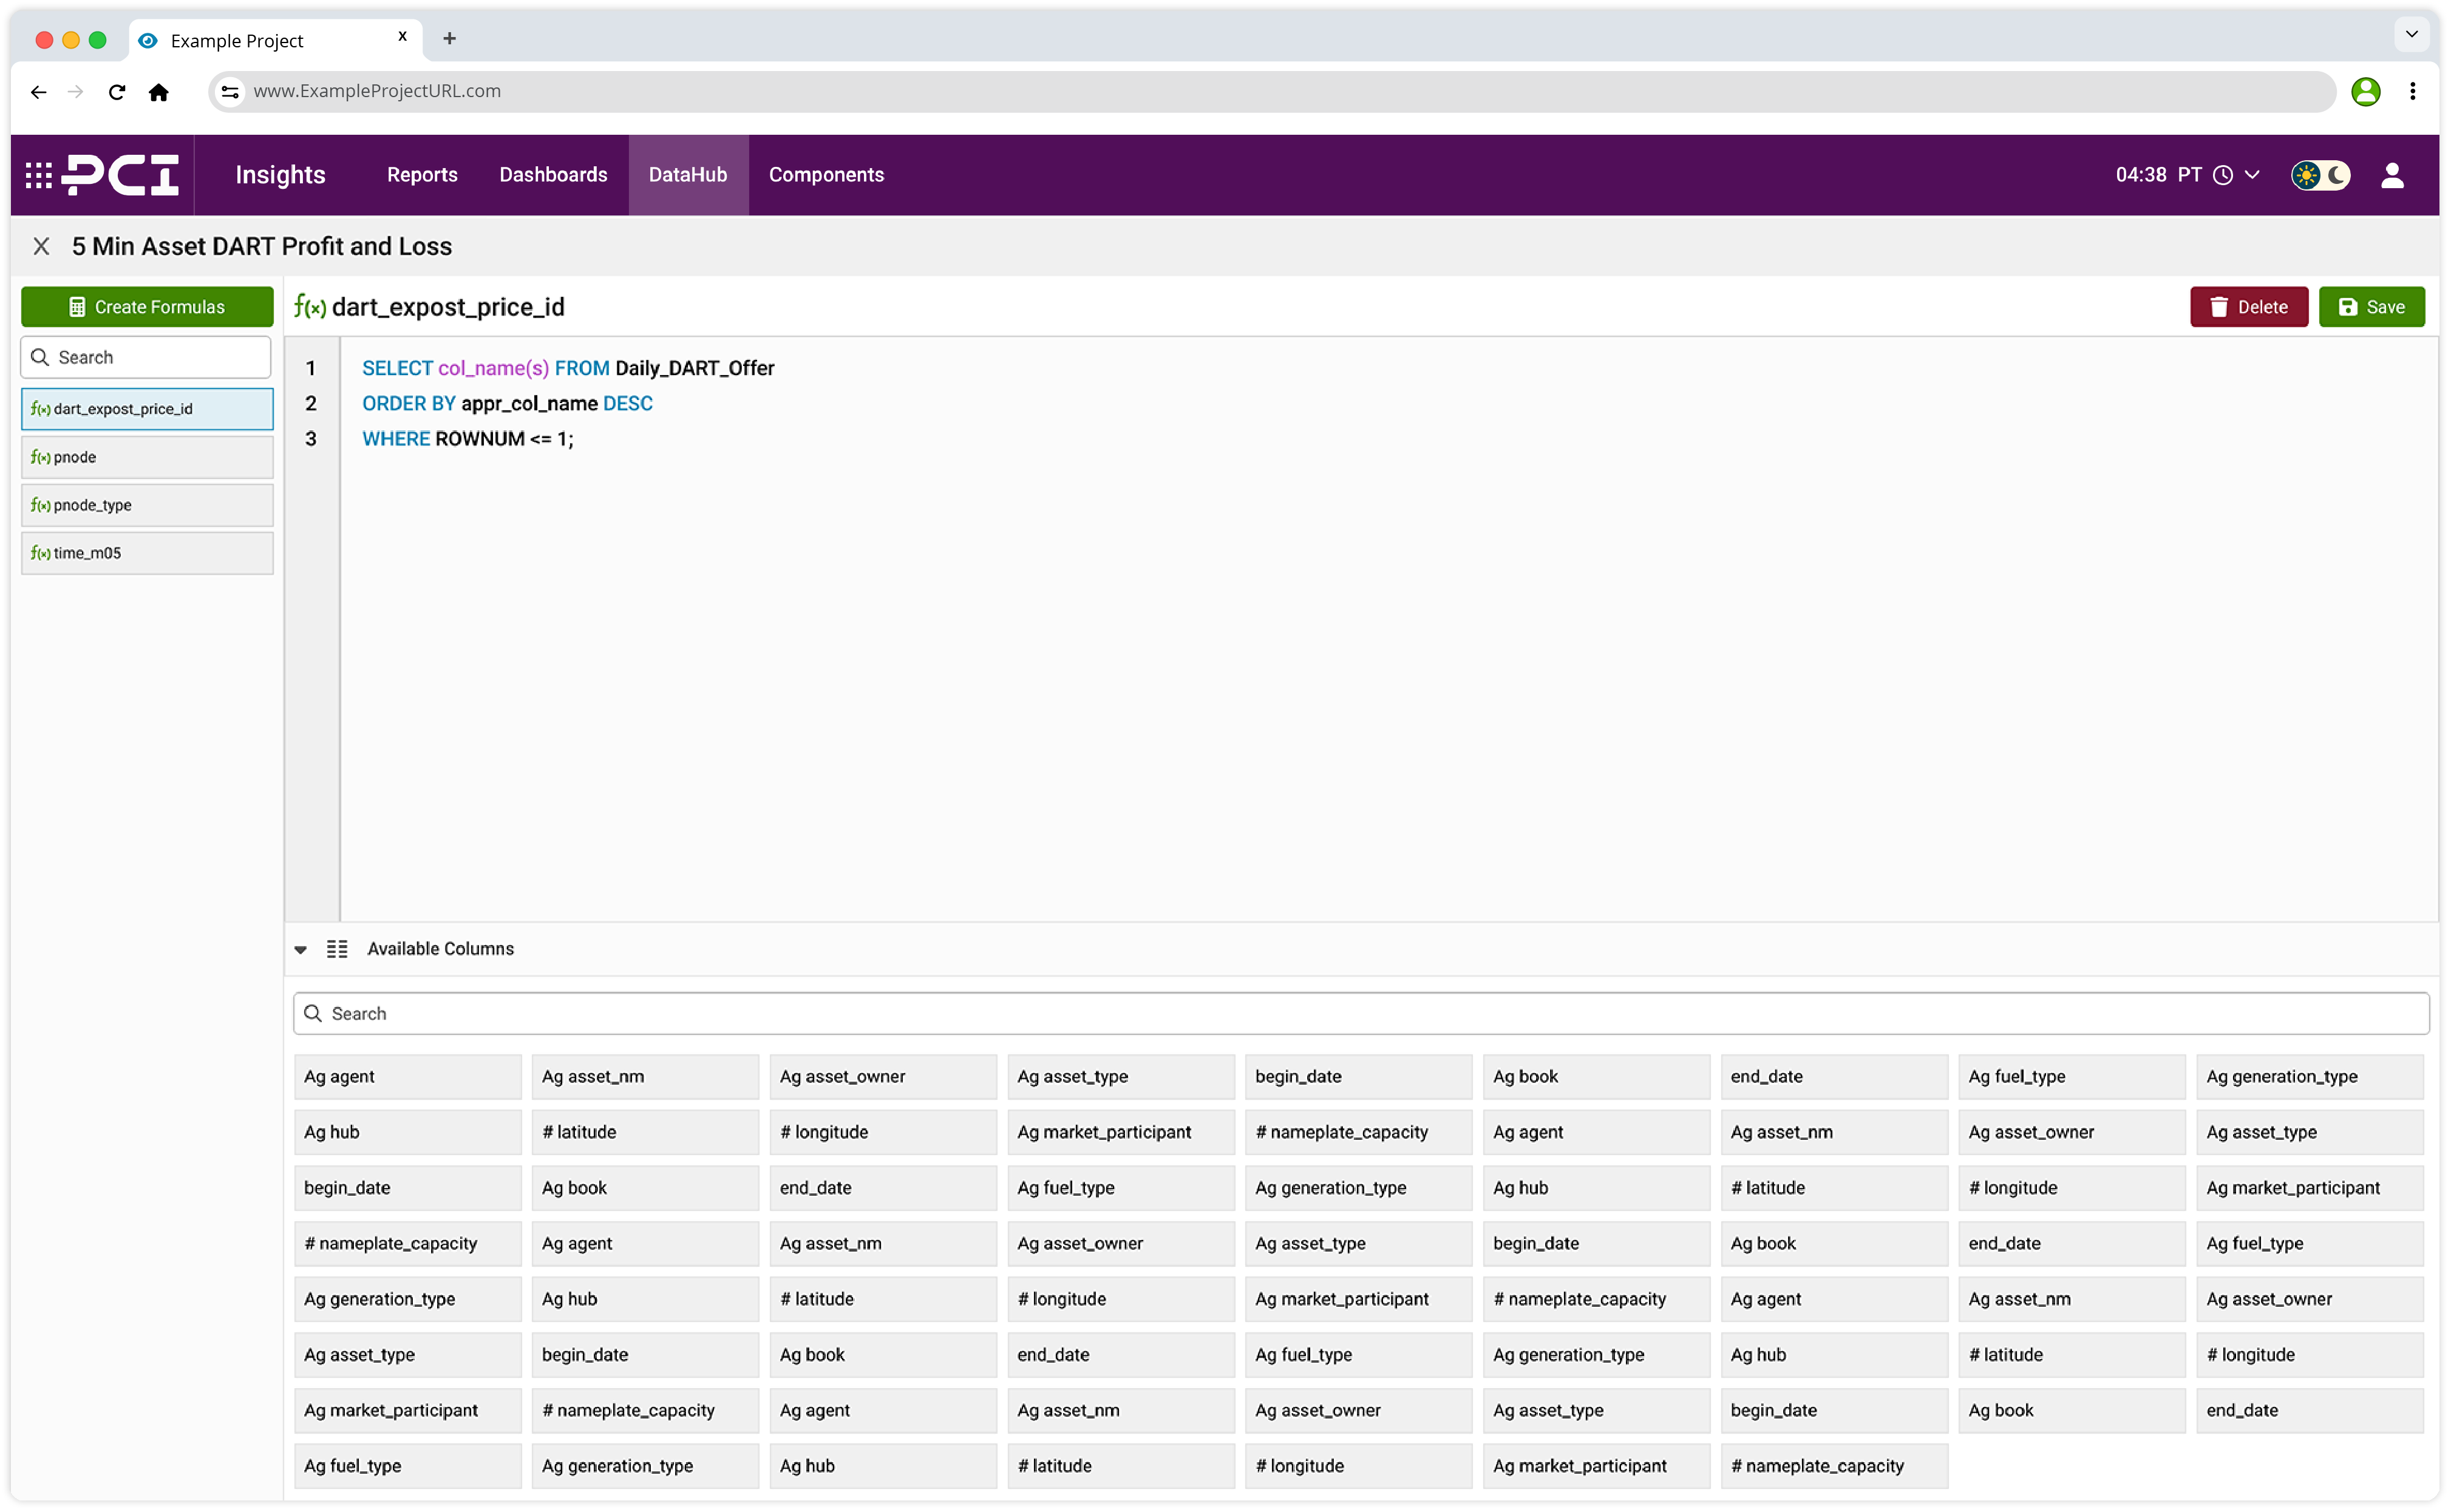
Combine datasets with visual and text components for detailed analysis.
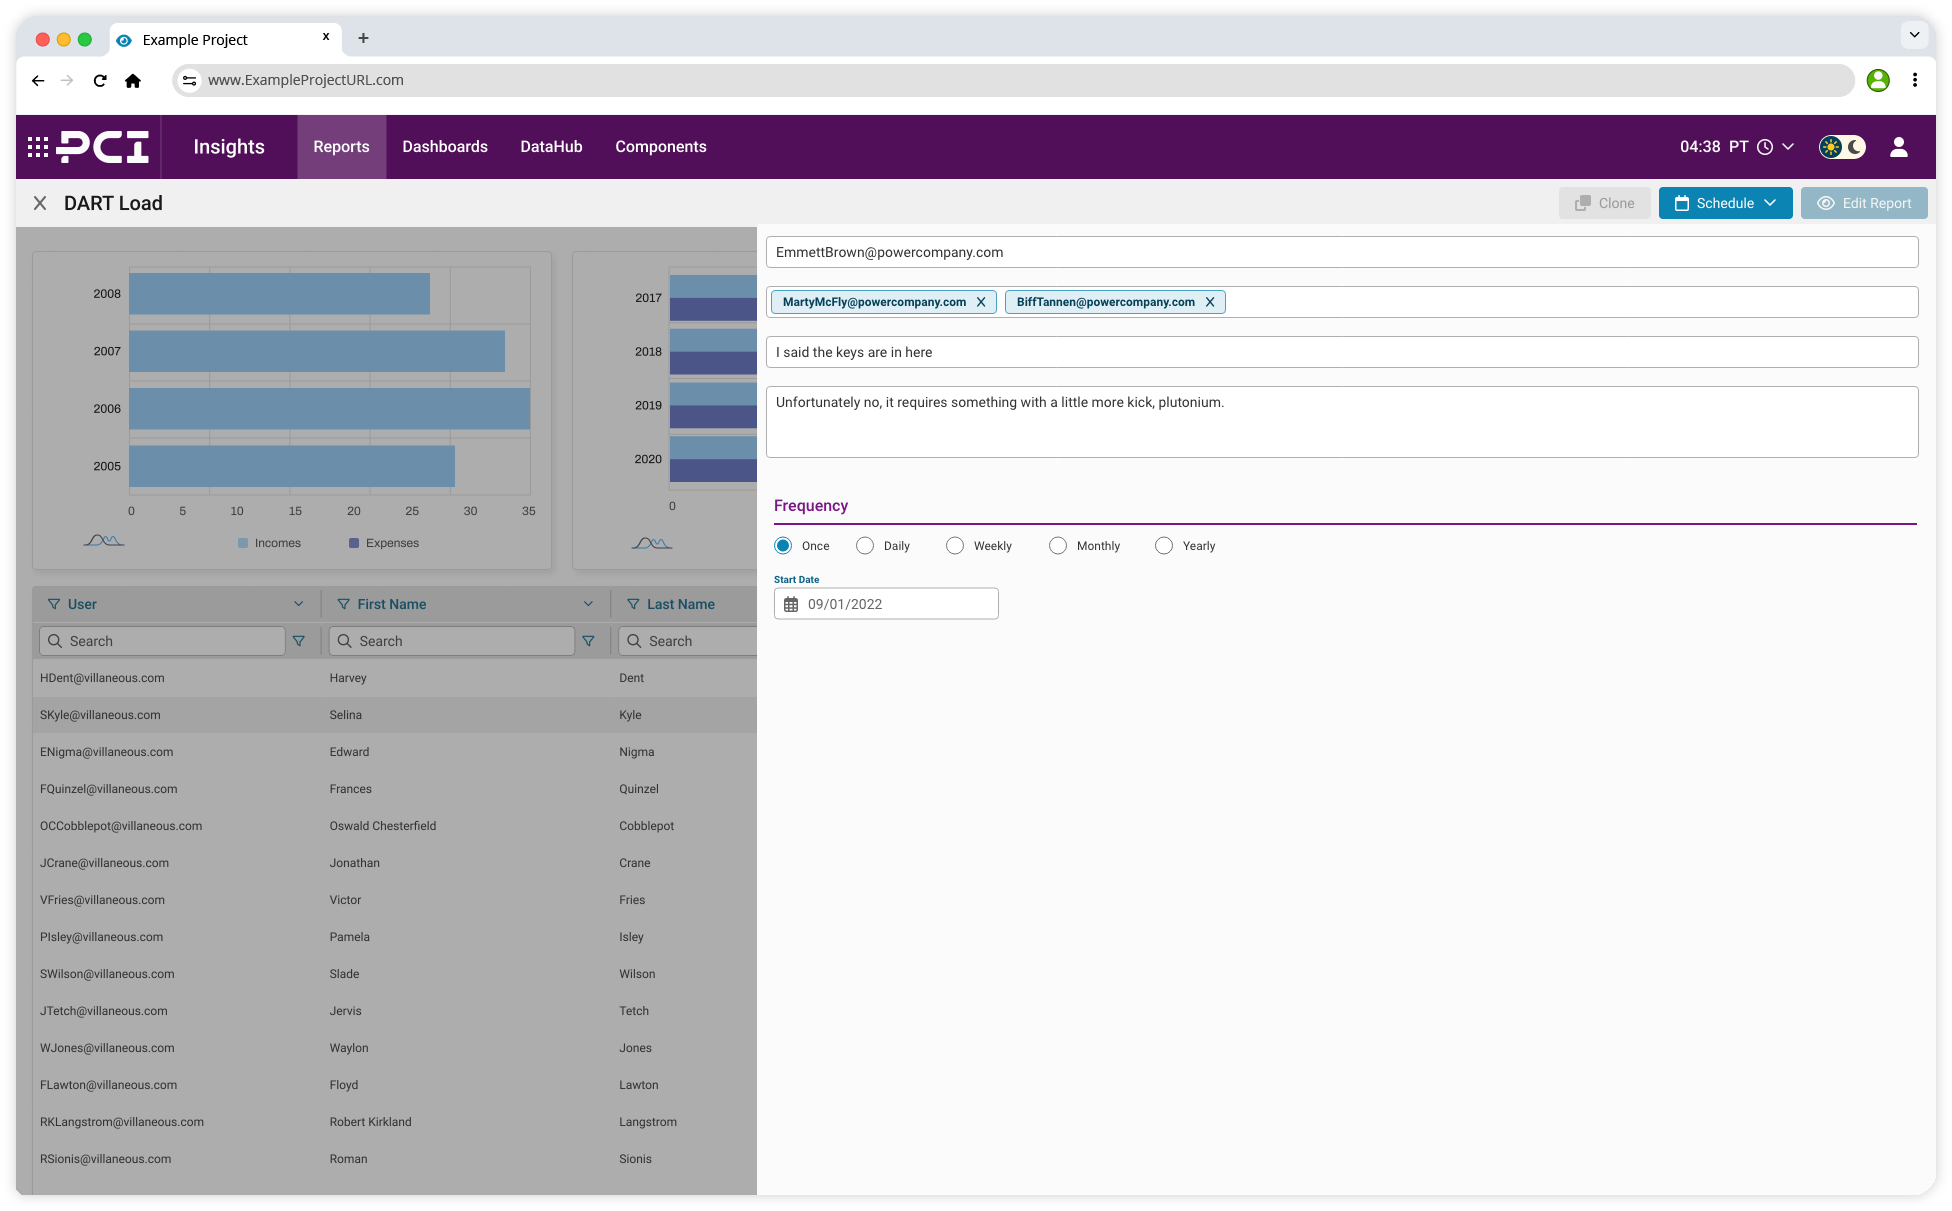
Share insights with stakeholders via multiple export options.
Reduction in time spent gathering and consolidating data.
Improvement in overall user satisfaction scores.
Adoption rate for users upgrading to the new product.
This project reinforced the value of UX research in uncovering user needs and highlighted the importance of component driven design for creating scalable solutions. By listening to users and iterating continuously, we delivered a product that transformed how energy professionals interact with their data. It also emphasized the importance of cross-functional collaboration to balance user-centered design with technical feasibility.

“Insights saves us hours each week—we can finally focus on analyzing data rather than finding it.”

“The ability to customize dashboards makes our workflows seamless.”
